Figure 2.

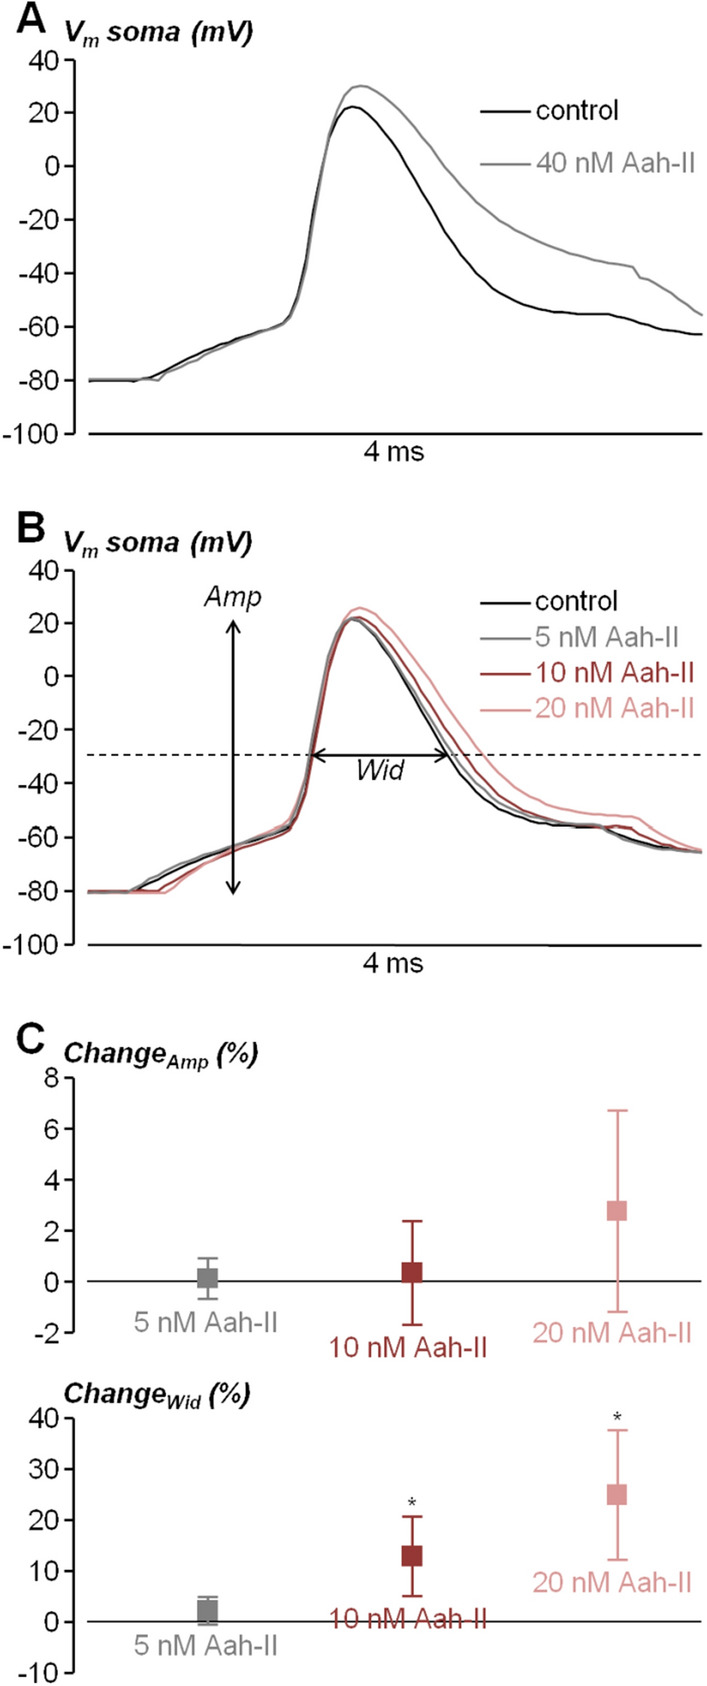
Dose–response analysis of the effect of AaH-II on the somatic AP from L5 pyramidal neurons in brain slices. (A) Somatic AP elicited by current pulse injection in a L5 pyramidal neuron in control condition (black trace) and after local delivery of 40 nM AaH-II (grey trace). (B) Somatic AP elicited by current pulse injection in another L5 pyramidal neuron in control condition (black trace) and after local delivery of 5 nM (grey trace), 10 nM (red trace) and 20 nM (pink trace) AaH-II. The amplitude (Amp) and width (Wid), used for the analysis, are indicated for the control trace. (C) Mean ± SD (N = 8 cells) of the Amp and Wid changes following AaH-II addition at 5 nM (grey lines and symbols), 10 nM (red lines and symbols) and 20 nM (pink lines and symbols). Values reported in the plot were the followings. For the Amp parameter: 5 nM—0.13 ± 0.81%; 10 nM—0.33 ± 2.02%; 20 nM 2.80 ± 3.94%. For the Wid parameter: 5 nM—2.34 ± 2.65%; 10 nM—12.83 ± 7.77%; 20 nM 25.41 ± 12.75%. “*” indicates that the change in the Wid parameter was significant at 10 nM (p = 0.0094, paired t-test) and at 20 nM (p = 0.0034, paired t-test).
