
Figure 4.
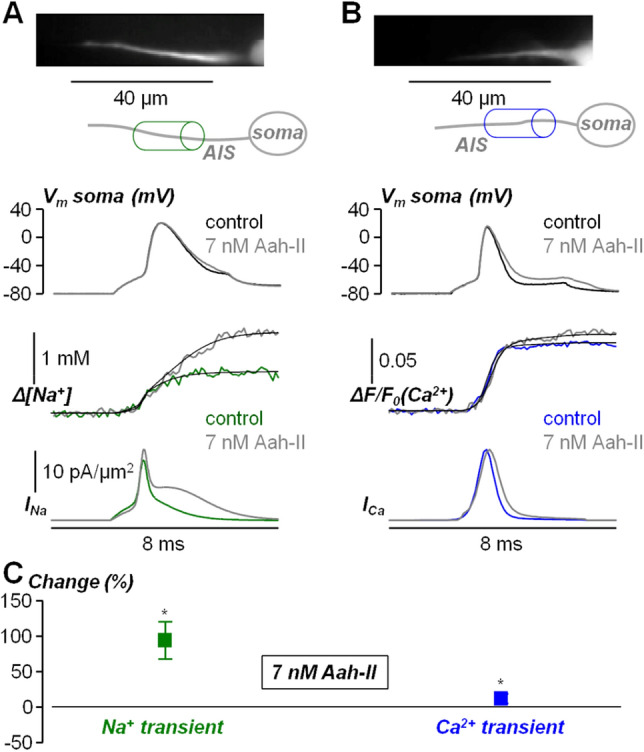
Effect of local delivery of 7 nM AaH-II on the Na+ and Ca2+ influx associated with the AP in the AIS. (A) Top, fluorescence image (Na+ indicator ING-2) of the AIS and its reconstruction with a region of interest indicated. Middle, somatic AP in control solution (black trace) and after delivering 7 nM of AaH-II (grey trace). Bottom, associated Na+ transients fitted with a model function to calculate the Na+ current (INa) in control solution (green trace) and after delivering 7 nM of AaH-II (grey trace). (B) Top, fluorescence image (Ca2+ indicator OG5N) of the AIS and its reconstruction with a region of interest indicated. Middle, somatic AP in control solution (black trace) and after delivering 7 nM of AaH-II (grey trace). Bottom, associated Ca2+ transients fitted with a model function to calculate the Ca2+ current (ICa) in control solution (blue trace) and after delivering 7 nM of AaH-II (grey trace). (C) Mean ± SD (N = 9 cells) of the Na+ (green lines and symbols) and Ca2+ (blue lines and symbols) changes following AaH-II addition. Values reported in the plot were 85.2 ± 25.9%for Na+ and 11.1 ± 5.3% Ca2+. “*” indicates that the change was significant for the Na+ (p = 1.07·10–6, paired t-test) and for Ca2+ (p = 1.58·10–5, paired t-test).