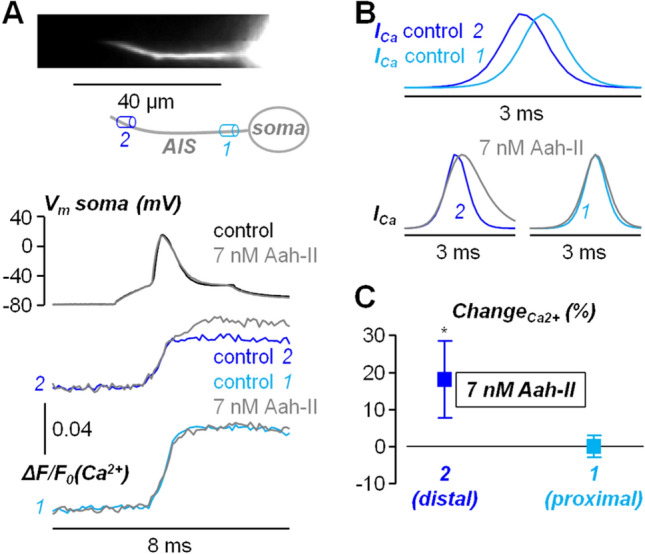
Figure 5.

Spatial effect of AaH-II delivery on the Ca2+ influx associated with the AP in the AIS. (A) Top, Ca2+ fluorescence image of the AIS and its reconstruction with a proximal region (1) and a distal region (2) indicated. Middle, somatic AP in control solution (black trace) and after AaH-II delivery (grey trace). Bottom, associated Ca2+ transients in 2 and 1 in control solution (dark trace and light blue trace respectively) and after delivering 7 nM of AaH-II (grey traces). (B) Top, superimposed Ca2+ currents (ICa) in 2 and 1 showing the different kinetics. Bottom, ICa in 2 and 1 in control solution (dark trace and light blue trace respectively) and after AaH-II delivery (grey traces). (C) Mean ± SD (N = 9 cells) of the Ca2+ changes in distal AIS regions (30–40 µm from the soma, dark blue lines and symbols) and in proximal AIS regions (5–15 µm from the soma, light blue lines and symbols). Values reported in the plot were 18.7 ± 10.3% in the distal AIS and 0.0 ± 3.0% in the proximal AIS. “*” indicates that the change was significant in the distal AIS (p = 0.0011, paired t-test).
