
Fig. 5.
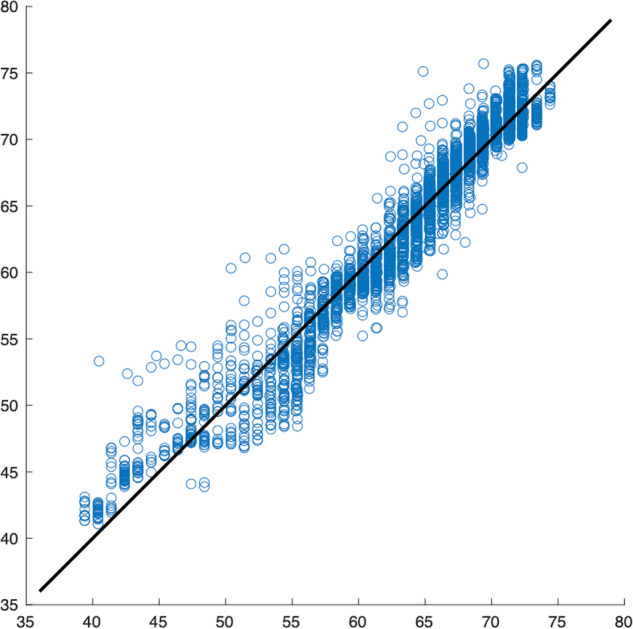
Scatter plot of the above results, where the model follows the signal. The horizontal axis represents the measured signal and the vertical axis the estimated signal. The identity function is shown in black.
Official websites use .gov
A
.gov website belongs to an official
government organization in the United States.
Secure .gov websites use HTTPS
A lock (
) or https:// means you've safely
connected to the .gov website. Share sensitive
information only on official, secure websites.
Scatter plot of the above results, where the model follows the signal. The horizontal axis represents the measured signal and the vertical axis the estimated signal. The identity function is shown in black.