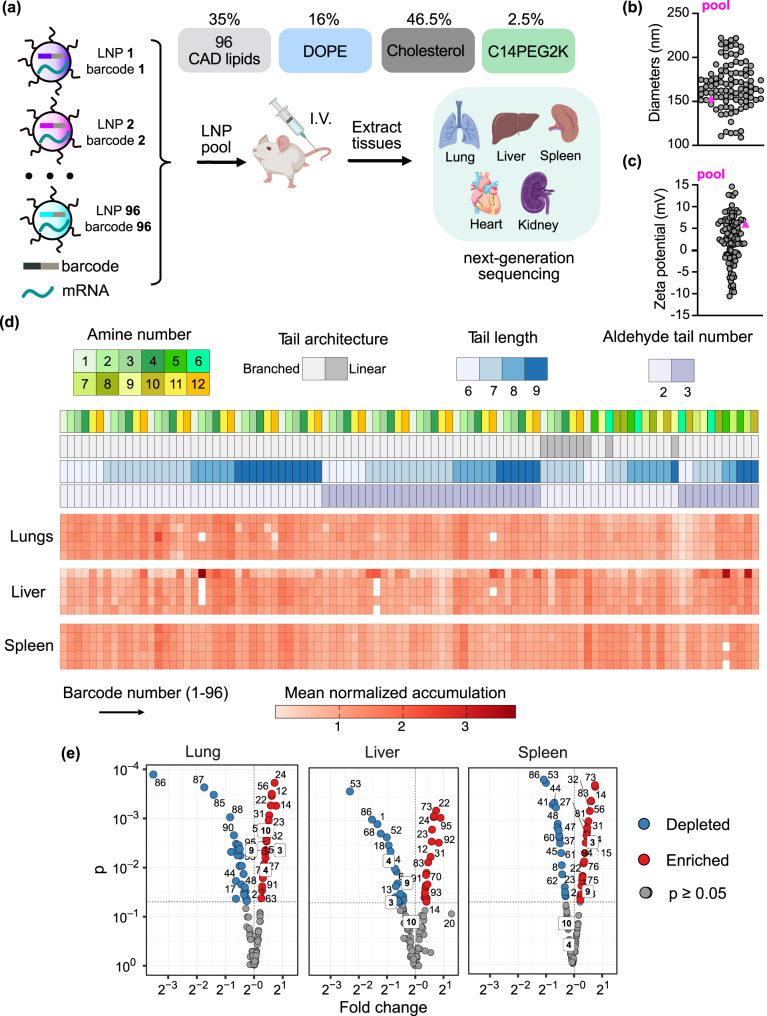
Fig. 3. In vivo structure-activity relationship analysis of 96 chemically distinct CAD lipids and organ tropism.
a Schematic illustration of barcoding approach to probe biodistribution profile of designed CAD LNPs. LNPs were formulated by pipette mixing to encapsulate barcoded DNA (b-DNA) and FLuc mRNA. Lipid phases consisted of one of 96 CAD lipids, DOPE, cholesterol, and C14PEG2K at a molar ratio of 35:16:46.5:2.5. LNP formulations were pooled together and administered systemically to C57BL/6 J female mice (n = 5). Tissues were isolated 6 h post-administration, DNA was extracted, and accumulation of b-DNAs was quantified by deep sequencing. I.V.: intravenous. b Hydrodynamic diameter of all administered CAD LNPs. The diameter of the LNP pool control (pink triangle symbol) falls within the range of the CAD LNPs composing the pool. c Zeta potential of all administered CAD LNPs. The zeta potential of the pooled LNP (pink triangle symbol) falls within the range of the CAD LNPs composing the pool. d Heatmap visualizing accumulation of CAD LNPs in different organs as measured by deep sequencing. Dark clusters represent higher relative accumulation of b-DNA in a specific tissue sample. Structural details of CAD lipids used in each LNP formulation are described above the heatmap. e Volcano plots summarizing enrichment analysis of barcodes in the lungs, liver, and spleen. The normalized accumulation of LNP formulation was compared to the aggregate LNP pool (i.e., basemean) using a two-sided Wilcoxon rank-sum test. False discovery rate was controlled using the Benjamini-Hochberg method. The exact P values from each comparison are provided in Supplementary Data 1. a Created with BioRender.com. Source data are provided in the Source Data file.

