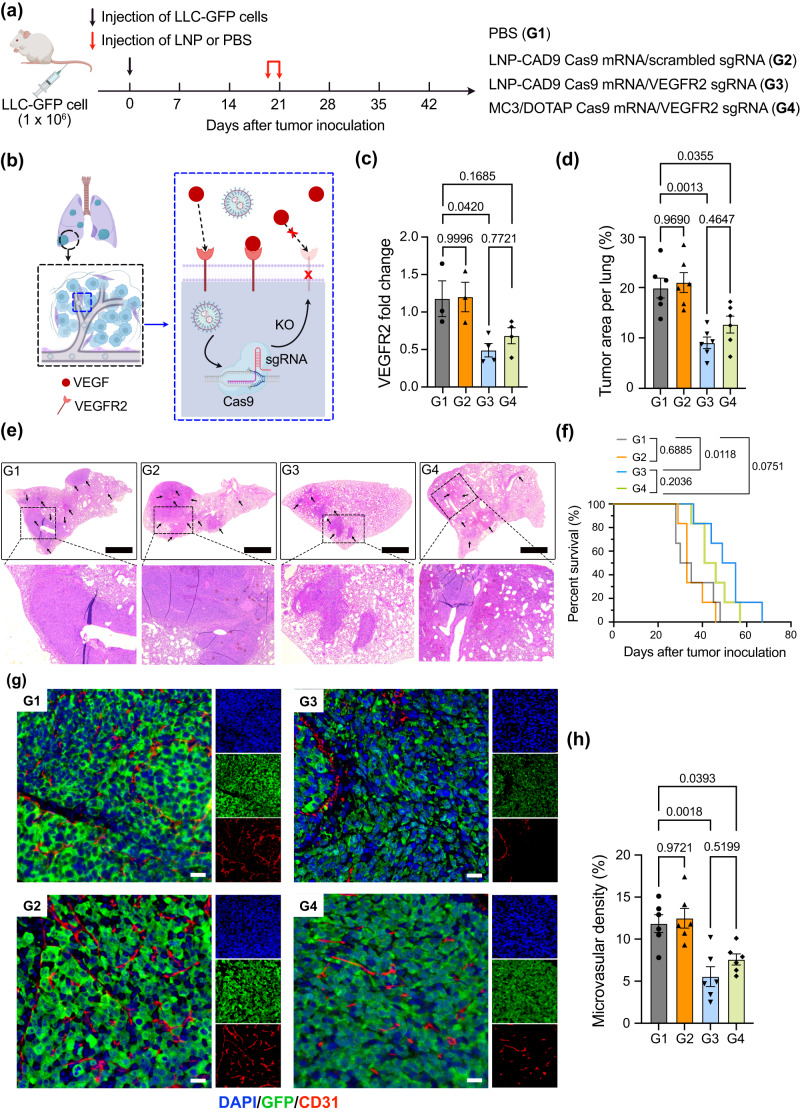
Fig. 5. Antiangiogenic therapy through knockout of VEGFR2 by LNPs in orthotropic lung cancer model.
a Schematic illustration of lung tumor implantation through i.v. injection of Lewis lung carcinoma cell lines expressing GFP (LLC-GFP) and treatment protocol of C57BL/6J female mice. On day 20 after tumor cell inoculation, mice were randomly assigned to four groups: PBS treated control (G1), LNP-CAD9 encapsulating Cas9 mRNA/scrambled sgRNA treatment (G2), LNP-CAD9 encapsulating Cas9 mRNA/VEGFR2 sgRNA treatment (G3), and MC3/DOTAP LNP encapsulating Cas9 mRNA/VEGFR2 sgRNA treatment (G4). Mice were treated every other day for a total of 2 doses (2.0 mg kg−1 of RNA per injection). Seven days after the last administration, 6 mice in each group were euthanized and their lungs were isolated for antiangiogenic analysis. The remaining mice were used for survival evaluation. b Antiangiogenic mechanism through LNP-mediated VEGFR2 knockout. LNPs encapsulating Cas9 mRNA/VEGFR2 sgRNA demonstrated the ability to reduce the expression of VEGFR2 in lung endothelial cells, which inhibited the VEGF-VEGFR2 pathway. KO: knockout. c RT-qPCR measurement of VEGFR2 level in different treatment groups (n = 3 mice for G1 and G2 groups; n = 4 mice for G3 and G4 groups). d Quantification of tumor areas per lung of different treatment groups (n = 6 mice). e Representative H&E staining of lung tissue after sacrifice (n = 6 mice). Arrows indicate tumor areas in the lungs. Scale bar: 1 mm. f Percent survival of mice under different treatments (n = 6 mice). g Representative immunostaining of tumor areas in the lungs. Endothelial cells were stained by CD31 antibody. DAPI was used for nuclear staining. Scale bar: 100 µm. h Microvascular density (MVD) in the tumor area under different treatments (n = 6 mice). a, b Created with BioRender.com. Statistical significance in (c), (d), and (h) was calculated using one-way analysis of variance (ANOVA), followed by Dunnett’s multiple comparison test. Statistical significance in (f) was calculated using a log-rank test. ***p < 0.001; **p < 0.01; *p < 0.05; p > 0.05, not significant. Data are presented as mean ± s.e.m. Source data are provided in the Source Data file.

