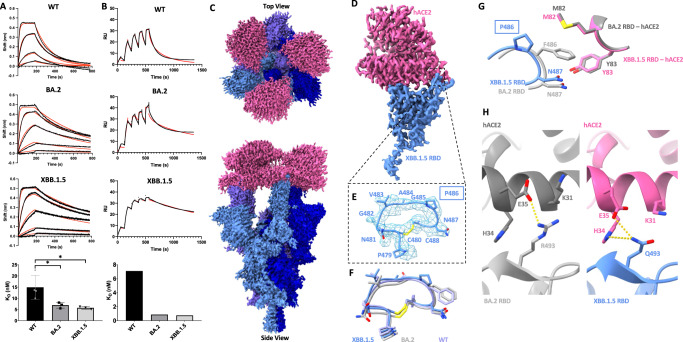
Fig. 2. Analysis of human ACE2 (hACE2) engagement by the XBB.1.5 spike protein.
A Biolayer interferometry analysis of WT, BA.2, and XBB.1.5 RBDs binding to immobilized dimeric hACE2. Black curves represent raw data which were fit to a model using a 1:1 binding stoichiometry (red) to determine the reported dissociation constants. Experiments were performed 4 times (n = 4) for the WT and 3 times (n = 3) for the remaining variants, and a representative curve is shown for each condition. Results are summarized at the bottom; error bars denote the standard deviation. Statistical significance was assessed via ANOVA with Dunnett’s post test for multiple comparisons against the WT (*P ≤ 0.05), WT vs BA.2 (P = 0.0412), WT vs XBB.1.5 (P = 0.0228). B Single-cycle kinetic analyses of WT, BA.2, and XBB.1.5 RBDs binding to immobilized dimeric hACE2 measured via surface plasmon resonance. Black curves represent raw data which were fit to a model using a 1:1 binding stoichiometry (red) to determine the reported dissociation constants which are tabulated below from a single experiment. RU: Response units. Experiments were performed one time. C Global Cryo-EM density map of the XBB.1.5 spike–hACE2 complex. D Local Cryo-EM density map of the hACE2–XBB.1.5 RBD region. E Map and model of the hACE2 binding ridge loop in the XBB.1.5 RBD when bound to hACE2. F Comparison of the hACE2 binding ridge loop region between XBB.1.5, BA.2, and WT RBDs when bound to ACE2. G Comparison of the hACE2 contacts made by RBD residues 486 and 487 in the XBB.1.5 and BA.2 RBD. H Comparison of the hACE2 contacts made by residue 493 within BA.2 and XBB.1.5 RBDs. Dashed lines indicate potential interactions (salt bridges or hydrogen bonds). Models were aligned by the RBD for all superpositions. PDB ID: 6M0J and 8DM6 were used for the WT-ACE2 complex and BA.2-ACE2 complex, respectively.

