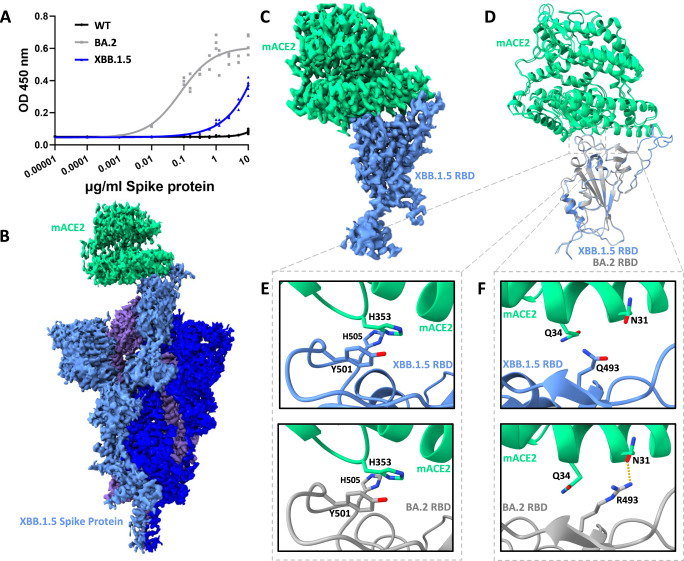
Fig. 3. The XBB.1.5 spike protein–mouse ACE2 interaction.
A ELISA of WT, BA.2, and XBB.1.5 spike proteins binding to mACE2. The results of two independent experiments are plotted, with technical triplicates performed in each experiment. OD450 nm: Optical density at 450 nm. B CryoEM density of XBB.1.5 spike protein bound to mACE2. The spike protein is shown in shades of blue and purple while mACE2 is shown in green. C As in (B), but for the focused-refined mACE2–XBB.1.5 RBD complex. D The resultant atomic model of the mACE2–XBB.1.5 RBD complex structurally aligned with the mACE2–BA.2 RBD complex (PDB ID: 8DM8). E Focused view of mutated residues Y501 and H505 in the mACE2–XBB.1.5 RBD complex (top) and mACE2–BA.2 RBD complex (bottom). F Focused view of RBD residue 493 in the mACE2–XBB.1.5 RBD complex (top) and mACE2–BA.2 RBD complex (bottom).

