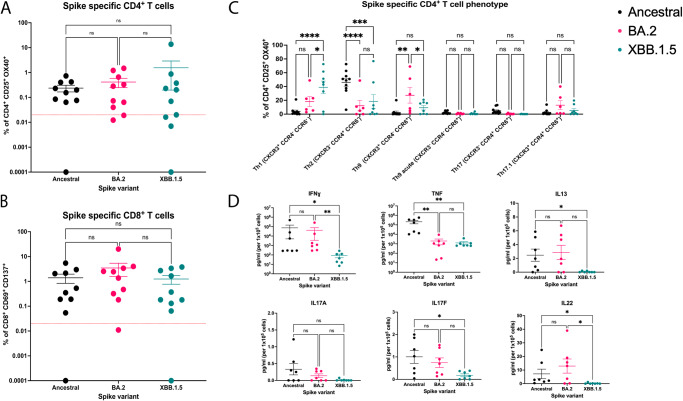
Fig. 5. T cell responses to ancestral (WT), BA.2 and XBB.1.5 SARS-CoV-2 spike proteins.
After 44-hours of stimulation with antigen we quantified the A frequency of spike protein specific CD4+ T cells (CD25+OX40+) and B frequency of spike protein specific CD8+ T cells (CD137+CD69+) in PBMCs from n = 10 vaccinated adults for three spike variants. Kruskal–Wallis tests with Dunn’s multiple comparisons tests were used to determine significant differences in T cell responses (ns not significant). C Phenotypic analysis of spike specific CD4+ T cells from (A), responses were of sufficient magnitude to quantify subsets for n = 10 ancestral, n = 6 BA.2 and n = 8 XBB.1.5 spike stimulated assays. A two-way ANOVA with Tukey’s multiple comparisons test was used to determine significant differences in CD4+ T cell phenotypes between spike variants. (*P ≤ 0.05, **P ≤ 0.01, ***P ≤ 0.0001, ns: not significant). Calculated P values are as follows: Th1: WT vs BA.2 (P = 0.1111), WT vs XBB.1.5 (P < 0.0001), BA.2 vs XBB.1.5 (P = 0.0164). Th2: WT vs BA.2 (P < 0.0001), WT vs XBB.1.5 (P = 0.0001), BA.2 vs XBB.1.5 (P = 0.6877). Th9: WT vs BA.2 (P = 0.0018), WT vs XBB.1.5 (P = 0.5457), BA.2 vs XBB.1.5 (P = 0.0427). Th9 acute: WT vs BA.2 (P = 0.9742), WT vs XBB.1.5 (P = 0.9732), BA.2 vs XBB.1.5 (P > 0.9999). Th17: WT vs BA.2 (P = 0.7978), WT vs XBB.1.5 (P = 0.7335), BA.2 vs XBB.1.5 (P = 0.9988). Th17.1: WT vs BA.2 (P = 0.3035), WT vs XBB.1.5 (P = 0.9065), BA.2 vs XBB.1.5 (P = 0.5498). D Cytokine concentrations in supernatants collected from spike-stimulated wells at 44 hours were quantified as pg/mL per 105 cells for n = 7 individuals. A two-way ANOVA with Tukey’s multiple comparisons test was used to determine significant differences in cytokine levels. (*P ≤ 0.05, **P ≤ 0.01, ns not significant). Calculated P values are as follows: IFNγ: WT vs BA.2 (P > 0.999), WT vs XBB.1.5 (P = 0.0153), BA.2 vs XBB.1.5 (P = 0.0032). TNF: WT vs BA.2 (P = 0.0050), WT vs XBB.1.5 (P < 0.0043), BA.2 vs XBB.1.5 (P > 0.9999). IL-13: WT vs BA.2 (P > 0.9999), WT vs XBB.1.5 (P = 0.0445), BA.2 vs XBB.1.5 (P = 0.0676). IL-17A: P = 0.2188). (IL-17F: WT vs BA.2 (P = 0.6622), WT vs XBB.1.5 (P < 0.0330), BA.2 vs XBB.1.5 (P = 0.1723). IL-22: WT vs BA.2 (P > 0.9999), WT vs XBB.1.5 (P = 0.0221), BA.2 vs XBB.1.5 (P = 0.0114).

