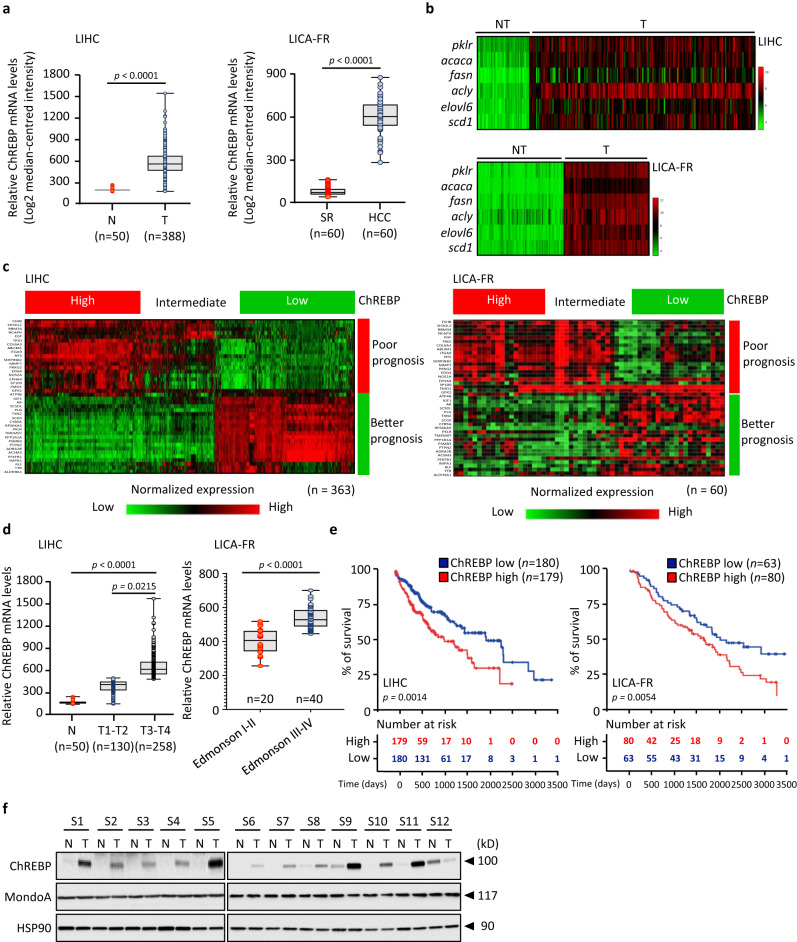
Fig. 1. ChREBP expression is increased in human HCC and signs tumors with poor prognosis.
a Data mining of ChREBP gene expression level between HCC (T) and normal liver tissues (N) from the LIHC and LICA-FR datasets relative to the TBP gene expression (Supplementary Data 1 and 2 and Source Data). b Heatmap showing the expression of well-described ChREBP-regulated genes in the LIHC and LICA-FR datasets relative to the TBP gene expression. c Heatmap of a 40-HCC gene signature, which classified the patients from the LIHC and LICA-FR datasets with either poor or better prognosis depending on ChREBP expression within the tumors relative to the TBP gene expression. ChREBP expression was divided into tertiles based on low, intermediate, or high expression levels. d ChREBP expression in HCC based on individual tumor grade from the LIHC and LICA-FR datasets relative to the TBP gene expression. e Kaplan–Meier analysis from the LIHC and LICA-FR Oncomine datasets depicting the overall survival rate of patients with low or high ChREBP expression levels within tumors (mRNA level, bottom 50% vs. top 50%). The tables shown below the Kaplan–Meier survival curves listed the number of patients at risk at a specific time point. f Expression profile of ChREBP and MondoA protein contents in 12 paired HCC (T) and adjacent non-tumoral tissues (N) (clinical characteristics of patients can be found as Source data provided as a Source Data file) (n = 12). a, d For all box plots, the boundary of the box closest to zero indicates the 25th percentile, a black line within the box marks the median, and the boundary of the box farthest from zero indicates the 75th percentile. Whiskers above and below the box indicate the 10th and 90th percentiles. Points above and below the whiskers indicate outliers outside the 10th and 90th percentiles (statistical analysis can be found in the Source Data file). a, d Statistical analyses were made using unpaired two-sided Student’s t test. e Significant difference in survival between cohorts was calculated using the log-rank (Mantel Cox) test. Source data are provided as a Source Data file.

