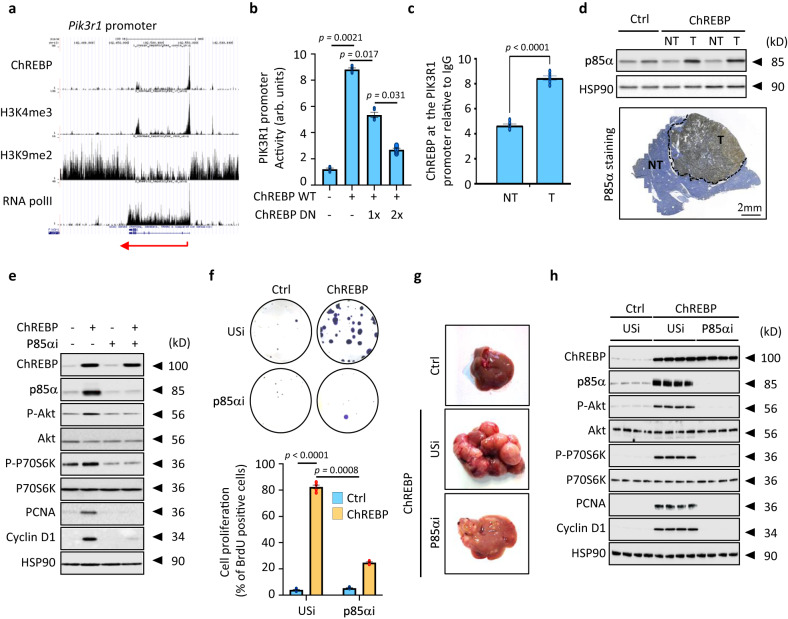
Fig. 4. p85α drives the stimulatory effects of ChREBP on PI3K/AKT signaling and hepatocyte proliferation.
a UCSC genome browser image illustrating normalized tag counts for ChREBP, H3K4me3, H3K9me2 and RNA polII at the Pik3r1 gene promoter. b Pik3r1 promoter activity in HEK 293 cells after ChREBP overexpression. A dominant negative form of ChREBP (DN ChREBP) was co-overexpressed to antagonize ChREBP action on Pik3r1 promoter. Pik3r1 promoter activity is relative to the RSV-β-galactosidase activity (arb. units = arbitrary unit) (n = 3 independent experiments). c ChIP experiments measuring ChREBP occupancy at the Pik3r1 promoter in ChREBP tumors relative to IgG controls (n = 6 biologically independent mice per group). d (Top panel) Representative Western blot analysis of p85α expression in ChREBP tumors (n = 10 biologically independent mice per group). (Bottom panel) Representative staining of liver sections with p85α antibody from ChREBP tumors (n = 10 biologically independent mice per group). NT, non-tumoral tissue; T, tumors. Scale bar = 2 mm. e, f P85α was stably inhibited in Huh7 cell line overexpressing ChREBP through Crispr/Cas9. e Representative Western blot analysis of PI3K/AKT signaling (n = 5). f (Top panel) Representative clonogenic assays shown (n = 8 independent experiments). (Bottom panel) Cell proliferation index determined by measuring the % of BrdU positive Huh7 cells (n = 5 independent experiments). g, h P85α was stably inhibited through Crispr/Cas9 in the liver of C57BL6/J mice overexpressing ChREBP using hydrodynamic injection. g Representative of tumor morphology is shown out of 10 mice per group (n = 10 biologically independent mice per group). h Representative Western blot of ChREBP and P85α expression levels in addition to PI3K/AKT signaling in tumors (n = 10 biologically independent mice per group). All error bars represent mean ± SEM. b Statistical analyses were determined by two-way ANOVA and Tukey’s multiple-comparisons test. c Statistical analyses were determined by unpaired two-sided Student’s t test. Source data are provided as a Source Data file.

