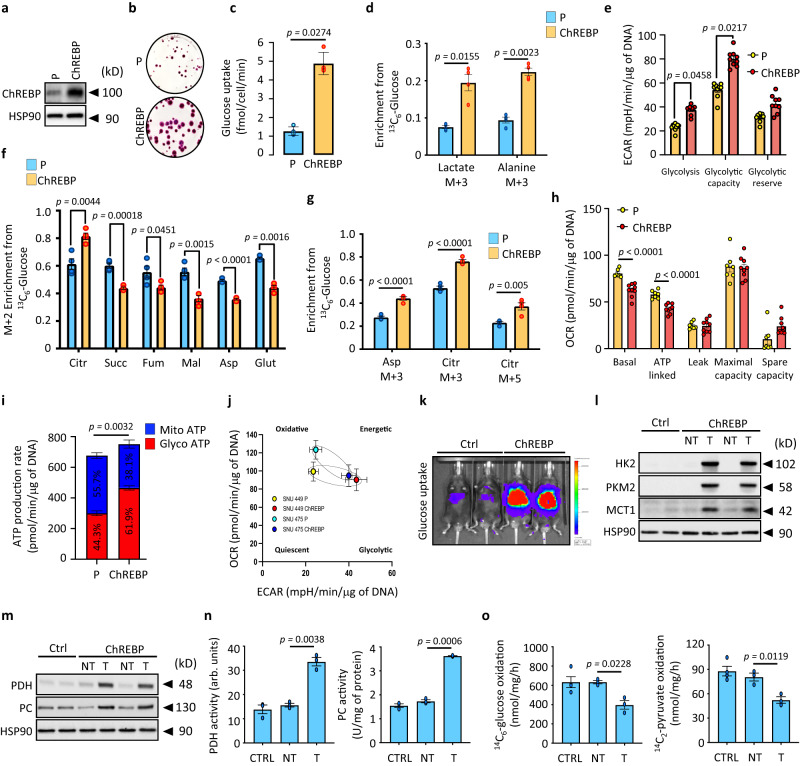
Fig. 6. ChREBP overexpression reroutes glucose metabolism away from oxidation to support glycolysis.
ChREBP was stably overexpressed using the Crispr/Cas9 technology in SNU449 hepatoma cell line. a Representative Western blot illustrating stable ChREBP overexpression. b Representative clonogenic assays shown (n = 3 independent experiments). c Rate of glucose uptake (n = 5 independent experiments). d Enrichment in (m+3) lactate and (m+3) alanine from 13C6-glucose in response to ChREBP overexpression (n = 4 independent experiments). e Graph showing glycolysis, glycolytic capacity, and glycolytic reserve of parental and ChREBP overexpressing SNU449 (n = 9 independent experiments). Representative curve can be found in supplementary Fig. 7c. f (m+2) enrichment in citrate (citr), succinate (succ), fumarate (fum), malate (mal), aspartate (asp) and glutamate (glut) from 13C6-glucose in response to ChREBP overexpression (n = 4 independent experiments). g Enrichment in (m+3) aspartate, (m+3) and (m+5) citrate from 13C6-glucose in response to ChREBP overexpression (n = 4 independent experiments). h Graph showing basal OCR, proton leakage, maximal respiration, spare capacity, and ATP production of parental and ChREBP overexpressing SNU449 (n = 9 independent experiments). Representative profile after mitochondrial stress assay showing the OCR of these SNU449 cells can be found in Supplementary Fig. 7d. i ATP production rate from glycolysis or oxidative phosphorylation in parental or ChREBP overexpressing SNU449 (n = 9 independent experiments). j Energy map charting basal OCR versus basal glycolysis values (n = 9 independent experiments). k–o ChREBP was stably overexpressed in liver of C57Bl6/J mice using the SB transposon system as previously described. k Representative image of liver glucose uptake of ChREBP overexpressing mice with BiGluc probe as described in83 (n = 5 biologically independent mice per group). l Representative Western blot analysis of glycolytic enzymes (n = 10 biologically independent mice per group). m Representative Western blot analysis of PDH and PC protein content in ChREBP tumors (n = 10 biologically independent mice per group). n Measurement of PDH and PC activity (n = 3 biologically independent mice per group). o Glucose and pyruvate oxidation rate determined by measuring the production of 14CO2 from 14C6-glucose or 14C-(2)-pyruvate for 4 h (n = 4 biologically independent mice per group). All error bars represent mean ± SEM. c–i Statistical analyses were determined by unpaired two-sided Student’s t test. n, o All statistical analyses were made using two-way ANOVA and Tukey’s multiple-comparisons test. Source data are provided as a Source Data file.

