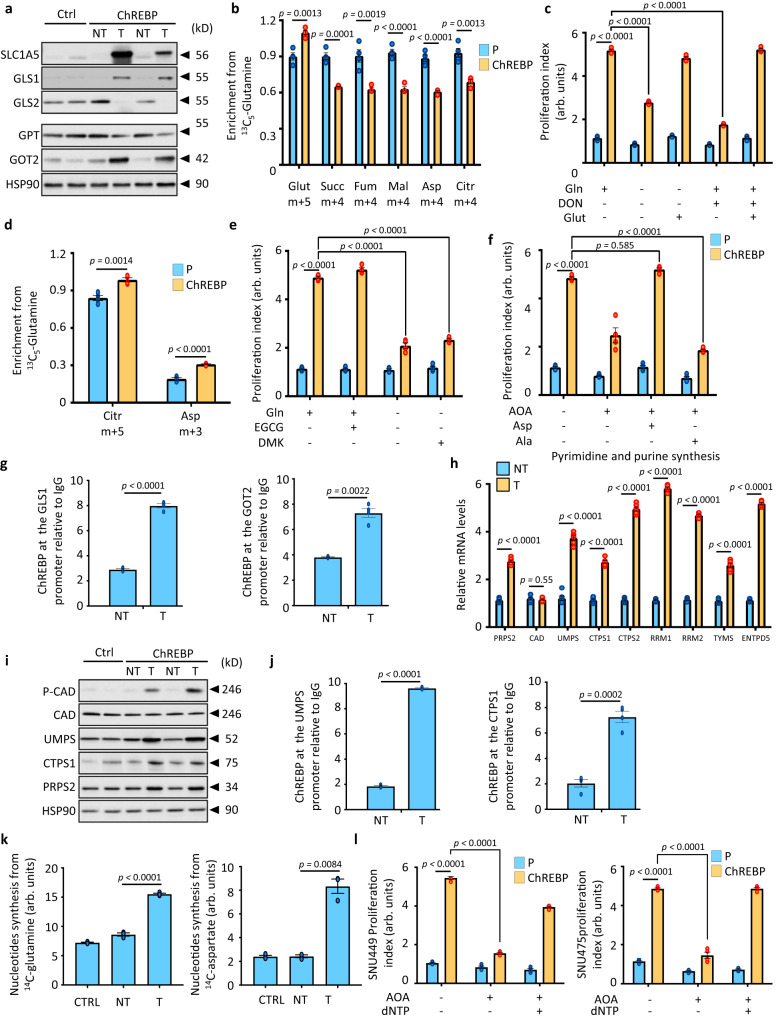
Fig. 8. ChREBP favors tumor growth by channeling glutamine metabolism into de novo pyrimidine synthesis.
a Representative Western blot analysis of proteins involved in Gln processing (n = 10 biologically independent mice per group). b Enrichment in (m+5) glutamate and (m+4) succinate, (m+4) fumarate, (m+4) malate, (m+4) aspartate and (m+4) citrate from 13C5-glutamine in response to ChREBP overexpression in SNU449 cells (n = 4 independent experiments). c Proliferation index of SNU449 cells overexpressing ChREBP after Gln deprivation or GLS inhibition (n = 4 independent experiments). Glutamate (Glu) 4 mM. d Enrichment in (m+3) citrate and (m+3) aspartate from 13C5-glutamine in response to ChREBP overexpression (n = 4 independent experiments). e Proliferation index of SNU449 cells overexpressing ChREBP after GLUD1 inhibition (n = 4 independent experiments). Dimethyl-αKG (DMK) 2 mM. f Proliferation index of SNU449 cells overexpressing ChREBP after AOA treatment (n = 4 independent experiments). Aspartate (Asp) or Alanine (Ala) (0.1 mM). g ChIP experiments measuring ChREBP occupancy at the GLS1 and GOT2 promoters relative to IgG controls in ChREBP tumors (n = 3 biologically independent mice per group). h Expression of genes involved in purine and pyrimidine synthesis relative to the TBP gene expression (n = 12 biologically independent mice per group). i Representative Western blot analysis of proteins involved in de novo pyrimidine synthesis (n = 10 biologically independent mice per group). j ChIP experiments measuring ChREBP occupancy at the UMPS and CTPS1 promoters in ChREBP tumors relative to IgG controls (n = 4 biologically independent mice per group). k Measurement of de novo nucleotide synthesis from 14C5-labeled Gln and 14C4-labeled Asp in ChREBP tumors (n = 3 independent experiments). l Proliferation index of SNU449 and SNU475 cells overexpressing ChREBP after dNTPs supplementation (100 mM each) and AOA treatment (n = 3 independent experiments). All error bars represent mean ± SEM. b, d, g, h, j Statistical analyses were determined by unpaired two-sided Student’s t test. c, e, f, k, i Statistical analyses were made using two-way ANOVA and Tukey’s multiple-comparisons test. Source data are provided as a Source Data file.

