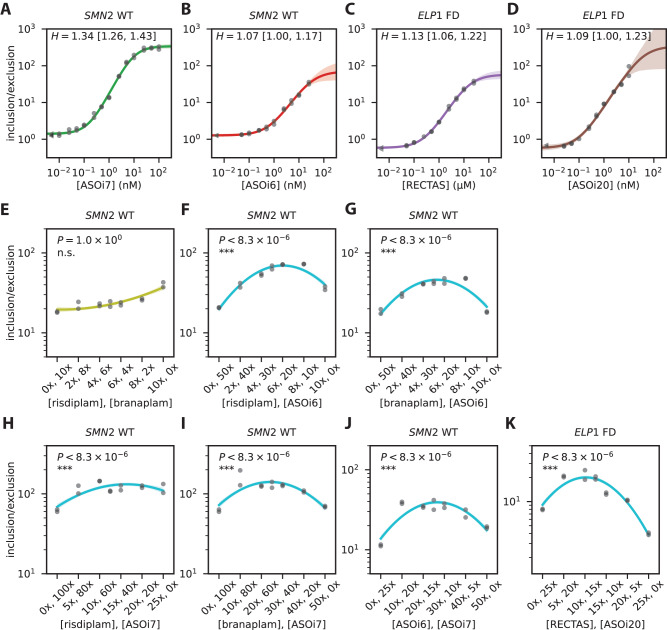
Fig. 6. Anomalous cooperativity and multi-drug synergy among splice-modifying drugs.
A, B Single-drug dose-response curves for SMN2 exon 7 in response to (A) ASOi7 and (B) ASOi6. C, D Single-drug dose-response curves for ELP1 exon 20 in response to (C) RECTAS and (D) ASOi20. Dots, median qPCR measurements of n = 4 technical replicates, shown for n = 2 biological replicates. Lines and shaded regions, predictions (median and 95% credible interval) of inferred dose-response curves. E–J Two-drug linear-mixture curves measured for SMN2 exon 7 in response to (E) risdiplam/branaplam mixtures, (F) risdiplam/ASOi6 mixtures, (G) branaplam/ASOi6 mixtures, (H) risdiplam/ASOi7 mixtures, (I) branaplam/ASOi7 mixtures, and (J) ASOi6/ASOi7 mixtures. K Two-drug linear-mixture curves measured for ELP1 exon 20 in response to RECTAS/ASOi7 mixtures. In panels E-K, curves are second-order polynomials fit to the data points shown using a Bayesian inference procedure (described in SI Sec. 4.5). 1x concentration of each drug (corresponding to approximate values) is 14 nM for risdiplam, 7 nM for branaplam, 0.6 nM for ASOi6, 0.1 nM for ASOi7, 300 nM for RECTAS, and 0.08 nM for ASOi20. , p-value for no-synergy null hypothesis (i.e., that the maximal inclusion/exclusion ratio occurs at one of the two ends of the mixture curve) computed using Hamiltonian Monte Carlo sampling as described in SI Sec. 4.5. ***, ; **, ; *,; n.s., .

