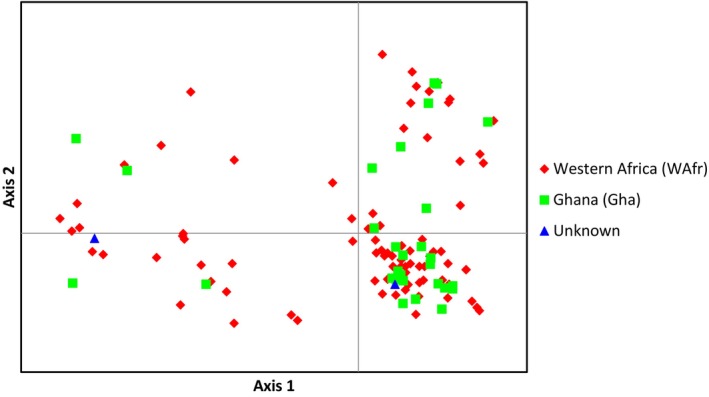
FIGURE 3.

Distribution of nuclear genetic variance (PCoA) within white‐bellied pangolins from West Africa according to mtDNA‐delimited lineages (WAfr and Gha). Axes 1 and 2 explain 11.35% and 8.10% of the total variation, respectively. See Figure S4 for further projections.
