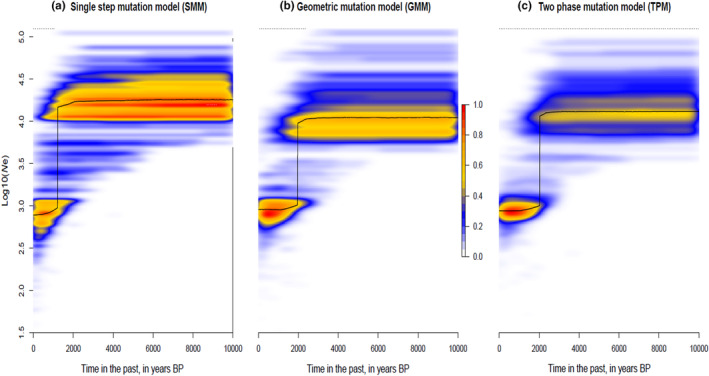
FIGURE 5.

Temporal change in the effective population size of white‐bellied pangolins in West Africa, as estimated from VarEff under three different mutation models. Mode (black line) and kernel density (color scale) of effective population size (Ne) posterior distributions are given in years BP.
