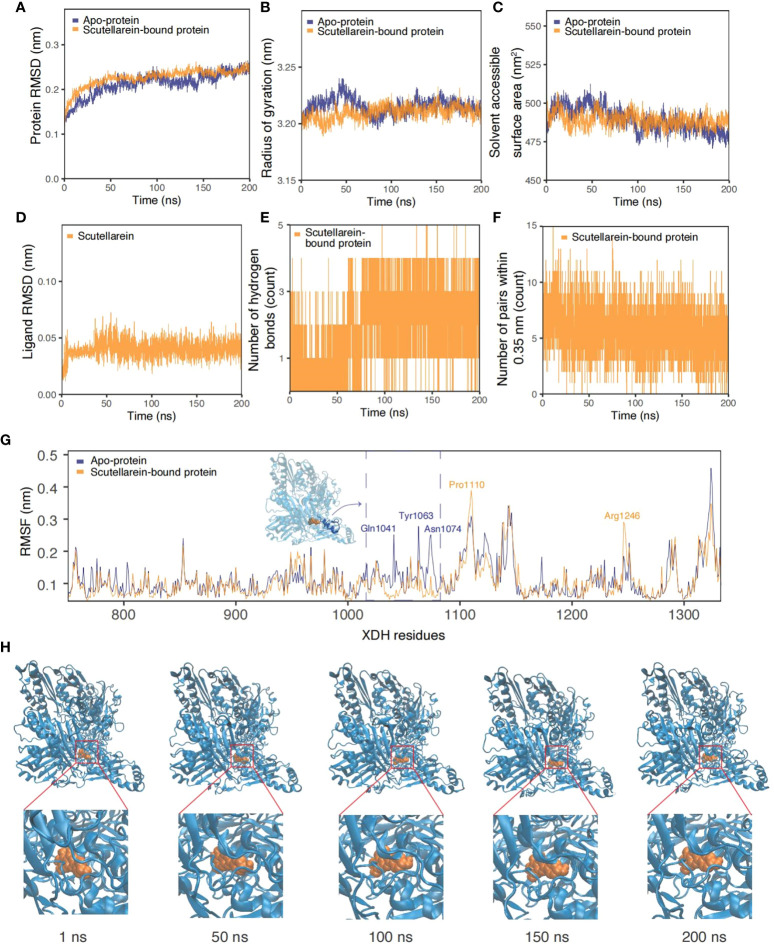
Figure 9.
Time-series analysis from the MDS trajectories of the apo-protein (blue) and scutellarein-bound protein (orange). (A) Protein backbone RMSD (nm), (B) Radius of gyration (nm), (C) Solvent accessible surface area (nm2), (D) Ligand scutellarein RMSD (nm), (E) Number of hydrogen bonds, (F) Number of pairs within 0.35 nm, (G) Per-residue RMSF (nm) highlighting the residues with the highest fluctuation and an accompanying inset of the protein structure, (H) Snapshots of the simulated trajectory of the protein (blue cartoon) bound to scutellarein (orange VDW) in 1 ns, 50 ns, 100 ns, 150 ns and 200 ns.

