
FIGURE 3.
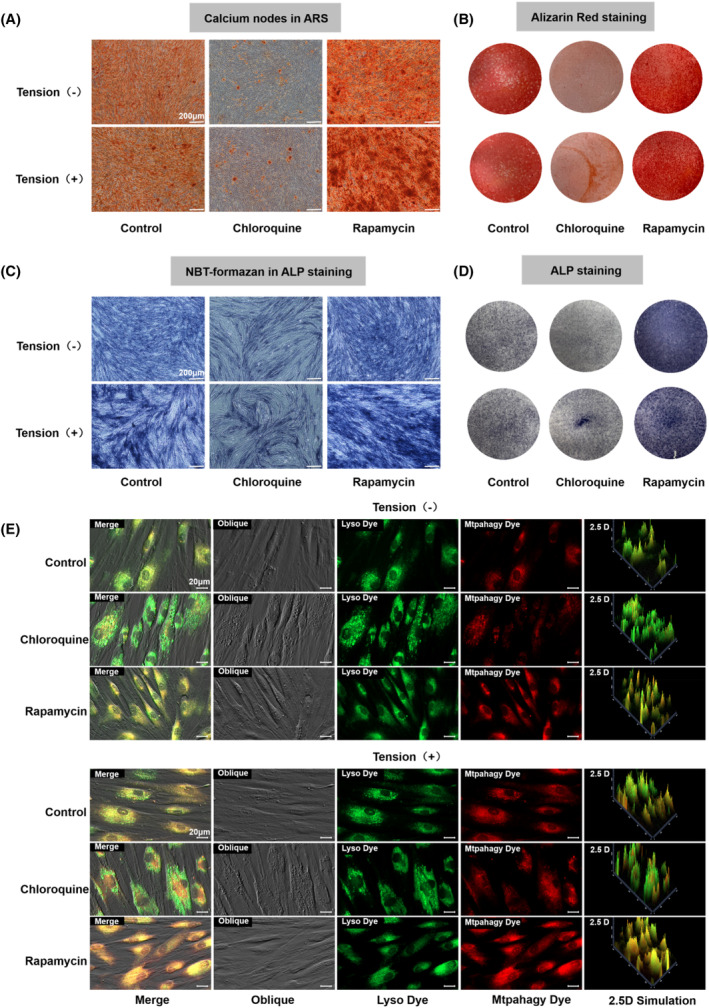
Effects of CTS on mitochondrial autophagy in PDLSCs. (A) Calcium nodules in alizarin red‐stained cells after osteogenic induction for 21 days. (B) Osteogenic differentiation was detected using alizarin red staining on day 21 (scale bars are 200 μm). (C) NBT formation in ALP‐stained cells after 7 days of osteogenic differentiation. (D) Osteogenic differentiation was detected using ALP staining on day 7 (scale bars are 200 μm). (E) The effect of CTS on mitochondrial autophagy was detected using the mitochondrial autophagy kit (scale bars are 20 μm; Lyso Dye: green; and Mtphagy Dye: red).