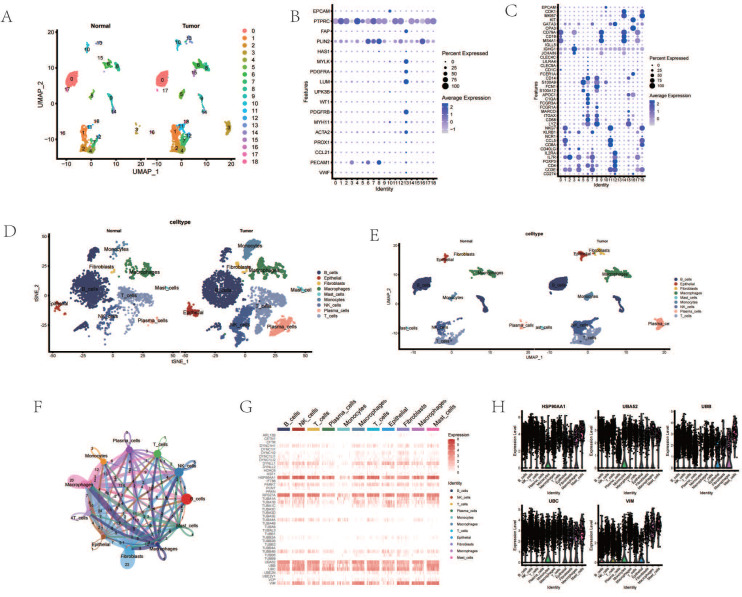
Figure 1.
Processing of Single-Cell Transcriptome Data. A. Dimensionality reduction clustering of ESCA samples. B. Expression of tissue cell marker genes. C. Expression of immune cell marker genes. D. Cell annotation tSNE clustering. E. Cell annotation UMAP clustering. F. Cell communication. G. Heatmap of AGG gene expression in different cells. H. Expression of AGG high expression genes in different cells.

