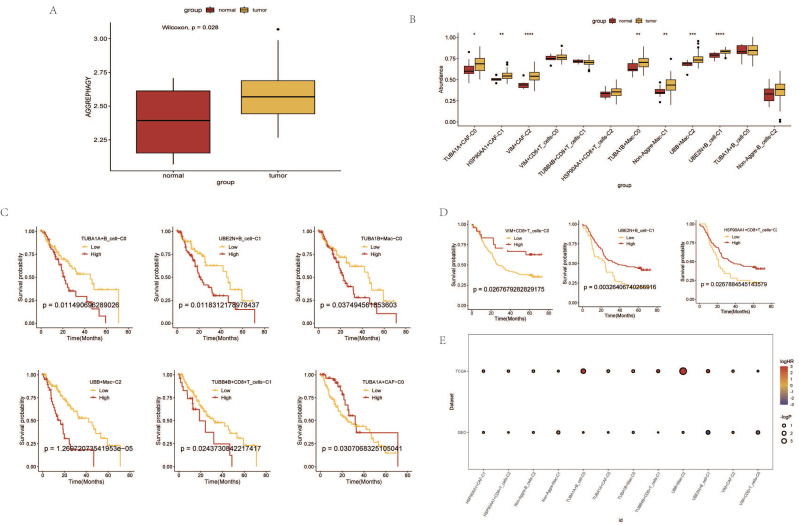
Figure 6.
Prognostic Analysis of AGG Clusters at the Transcriptomic Level.A. Differential analysis of AGG gene set in TCGA via ssGSEA. B. Expression profiles of different AGG clusters in TCGA. C. Prognostic value of AGG clusters in TCGA. D. Prognostic value of AGG clusters in GEO. E. Prognostic risk bubble chart of AGG clusters in both TCGA and GEO.

