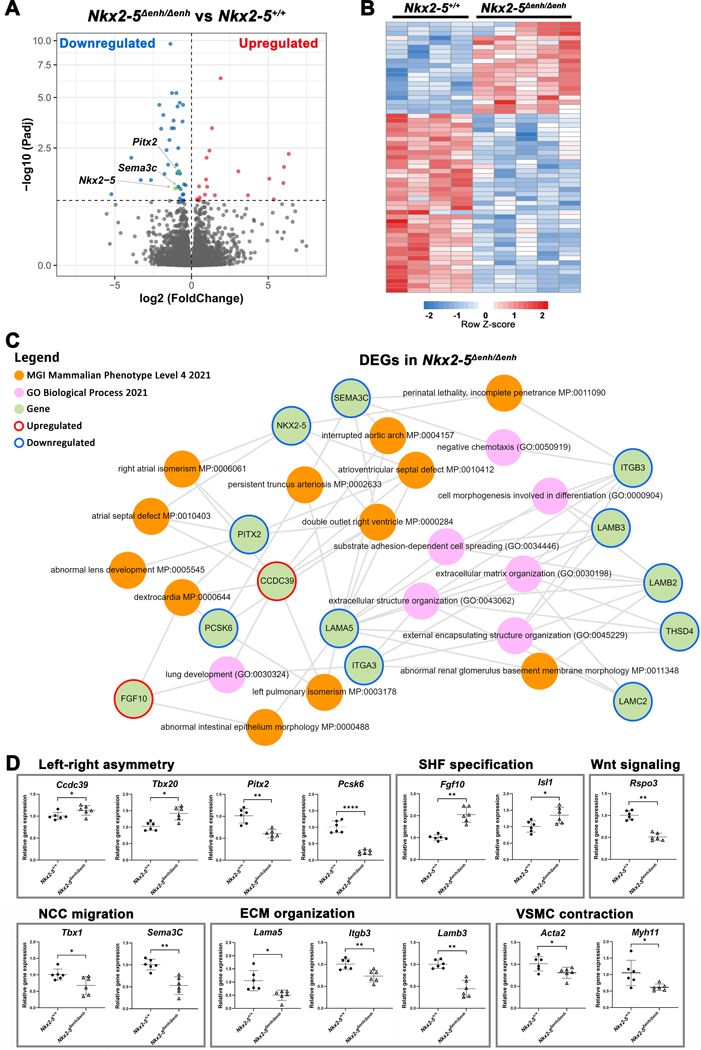
Figure 5. Transcriptome analysis of the embryonic outflow tract (OFT) in Nkx2–5∆enh/∆enh vs. wildtype mice.
(A) Volcano plot of all annotated genes in Nkx2–5∆enh/∆enh vs wildtype OFT. Significantly upregulated genes are highlighted in red and downregulated genes are in blue (adjusted p value < 0.1) with the verticle gray dashed line representing the boundary for identification of up- or down-regulated genes. The horizontal grey dashed line represents significance. Key genes (Nkx2–5, Pitx2 and Sema3c) in OFT development are colored in green. (B) Heatmap of differentially expressed genes (DEGs, adjusted p value < 0.1) between Nkx2–5∆enh/∆enh vs. wildtype OFT (n = 5 and 4, respectively). (C) Subnetwork analysis by Enrichr-KG. All DEGs from panel B were analyzed. The MGI Mammalian Phenotype and Gene Ontology Biological Process gene set libraries were selected for the analysis. Enrichment of phenotypes and descriptive biological processes are shown. (D) Validation qPCR of key genes in the OFT at E12.5. Genes are grouped based on assigned biological process. *p < 0.05, **p < 0.01, ****p < 0.0001 by Student’s t-test. Data are presented as mean ± SD. n = 6 per group. SHF, second heart field; VSMC, vascular smooth muscle cell; NCC, neural crest cell; ECM, extracellular matrix.

