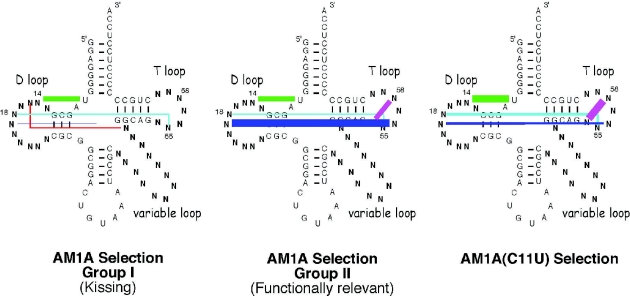
Figure 3.
Schematic representation of the relative percentage of native tRNA tertiary base pairings observed for each of the selection groups shown in Figure 2. Tertiary base pairings are color coded as in Figure 2. Relative percentage of selected tRNA sequences with designated base pairing represented by line widths as follows: <10%, hairline; 10–19%, 1 pt line; 20–39%, 2 pt line; 39–50%, 4 pt line; >50%, 6 pt line.

