
FIGURE 1.
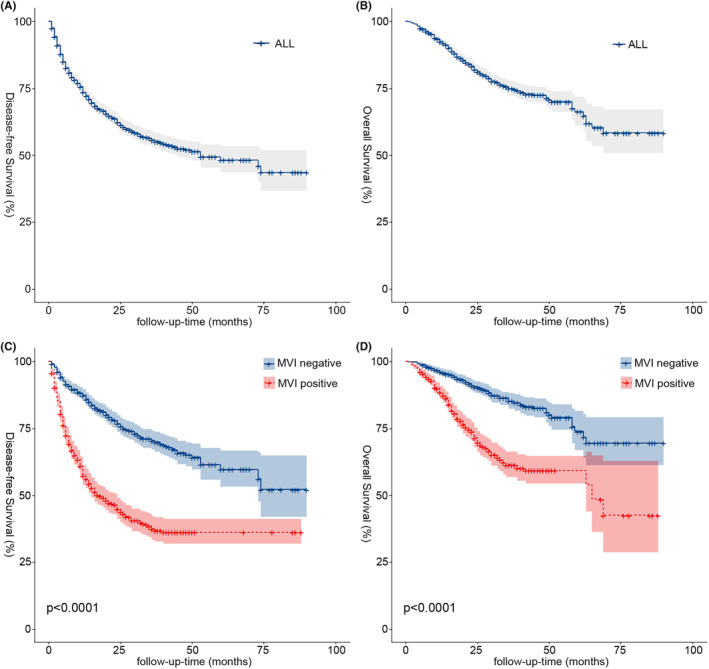
Kaplan–Meier analyses of DFS and OS for all patients (A, B) and MVI (C, D). The lightly stained areas on both sides of the curve are 95% CI ranges. DFS, disease‐free survival; MVI, microvascular invasion; OS, overall survival.
Official websites use .gov
A
.gov website belongs to an official
government organization in the United States.
Secure .gov websites use HTTPS
A lock (
) or https:// means you've safely
connected to the .gov website. Share sensitive
information only on official, secure websites.
Kaplan–Meier analyses of DFS and OS for all patients (A, B) and MVI (C, D). The lightly stained areas on both sides of the curve are 95% CI ranges. DFS, disease‐free survival; MVI, microvascular invasion; OS, overall survival.