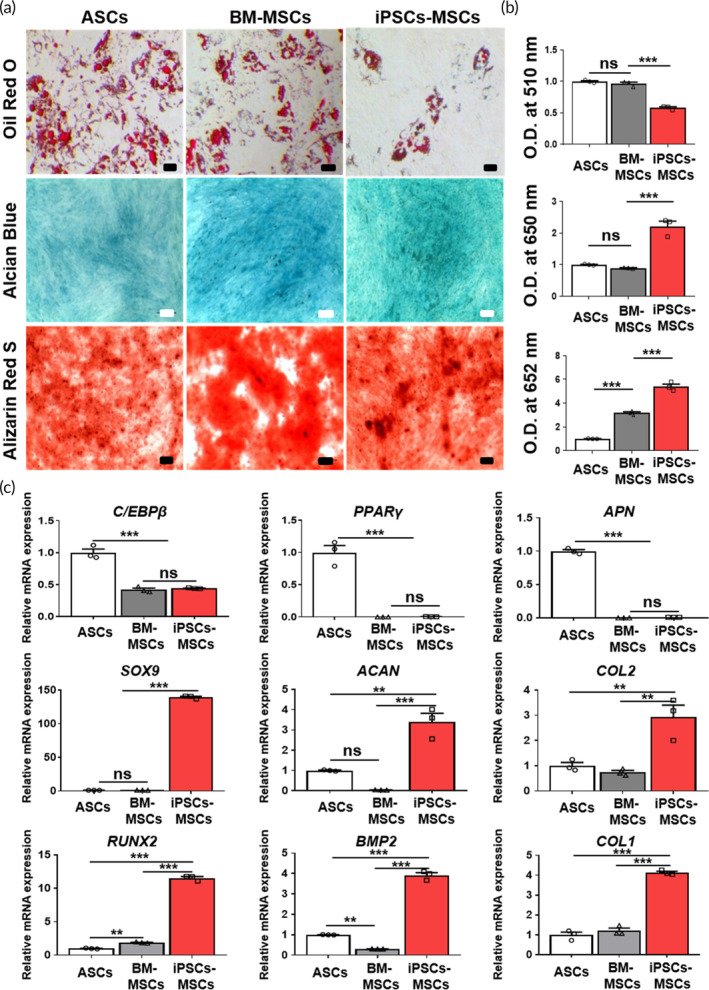
FIGURE 4.

Confirmation of the in vitro multi‐lineage differentiation of iPSCs‐MSCs. (a) Representative image of differentiation potential evaluation through Oil Red O (adipogenic), Alcian blue (chondrogenic), and Alizarin Red S staining (osteogenic) and (b) the quantitative absorbance value. Scale bar, 100 μm. The data are presented as the means ± s.d. (n = 3, biologically independent samples). *p < 0.05, **p < 0.01, ***p < 0.001, ns: no significance; based on one‐way ANOVA followed by Tukey's post hoc test. (c) Real‐time PCR analyses were conducted to assess the differences in the mRNA expression of adipogenic markers (C/EBPβ, PPARγ, APN), chondrogenic markers (SOX9, ACAN, COL2), and osteogenic markers (RUNX2, BMP2, COL1) between ASCs, BM‐MSCs, and iPSCs‐MSCs. The data are presented as the means ± s.d. (n = 3, biologically independent samples). *p < 0.05, **p < 0.01, ***p < 0.001, ns: no significance; based on one‐way ANOVA followed by Tukey's post hoc test.
