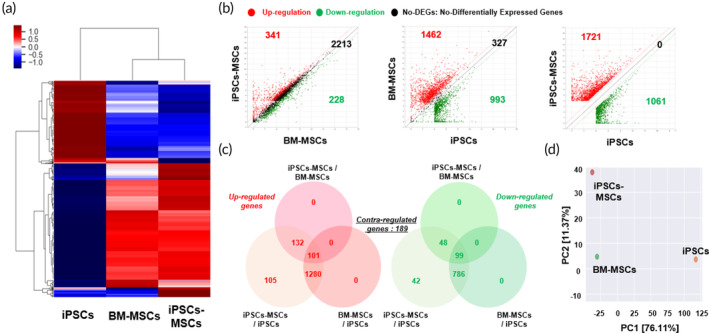
FIGURE 5.

Global gene expression profile showing the biological comparison between iPSCs, BM‐MSCs, and iPSCs‐MSCs. (a) Heatmap showing the variations in gene expression patterns between iPSCs, BM‐MSCs, and iPSCs‐MSCs. (b), (c) Scatter plot and Venn diagram showing upregulated and downregulated genes between different groups (iPSCs‐MSCs vs BM‐MSCs, BM‐MSCs vs. iPSCs, and iPSCs‐MSCs vs. iPSCs). (d) Principal component analysis showing similarities between iPSCs, BM‐MSCs, and iPSCs‐MSCs.
