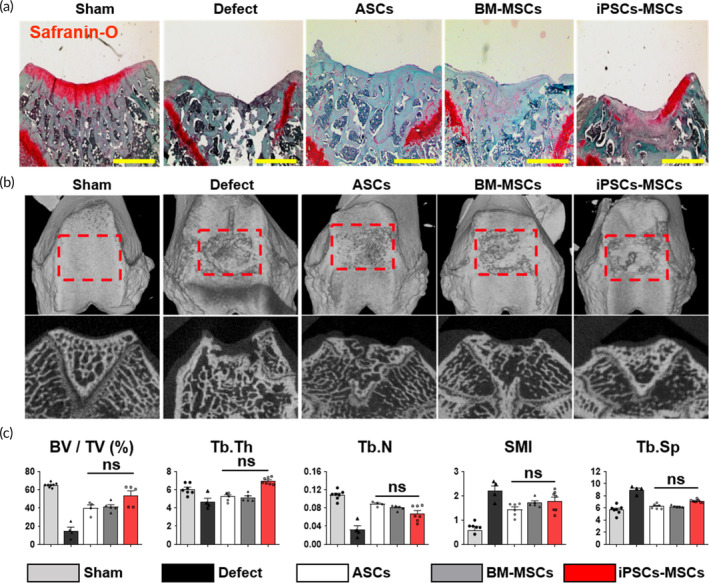
FIGURE 6.

Therapeutic potential of iPSCs‐MSCs in osteochondral defect model. (a) Confirmation of chondrogenesis potential of iPSCs‐MSCs compared with ASCs and BM‐MSCs through Safranin‐O staining. Scale bar, 500 μm. (b) Three‐dimensional (3D) reconstructed image and cross‐sectional image of micro‐CT at 8 weeks. The regions of interest (ROI) indicated with the red squares were analyzed via bone histomorphometry (n = 6, animal per sham; n = 5 animal per groups). (c) The analyzed ROI data are expressed with the following parameters: percent bone volume (BV/TV, %), trabecular thickness (Tb.Th, mm), trabecular number (Tb.N, 1/mm), structure model index (SMI), and trabecular separation (Tb.Sp, mm). Data are presented as the means ± s.d. (n = 6 animal per sham; n = 4–5 animal per groups). *p < 0.05, **p < 0.01, ***p < 0.001, ns: no significance; based on one‐way ANOVA followed by Tukey's post hoc test.
