FIGURE 2.

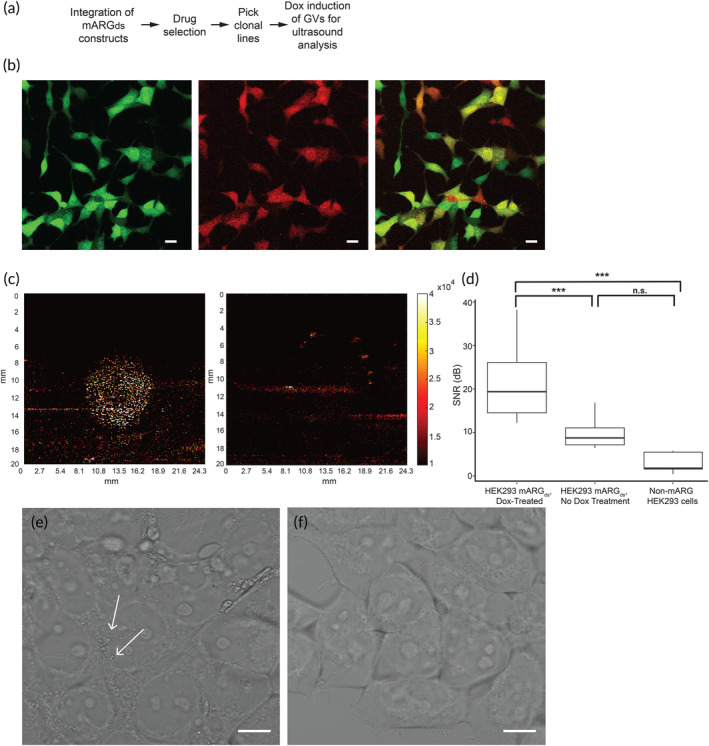
Single cell mARGds HEK293T cells express gas vesicles and produce ultrasound contrast. (a) Process flow for generating gas vesicle‐producing single‐cell clone HEK293T cell lines. (b) Clone 6 HEK293T mARGds gene expression validated by fluorescence microscopy. Scale bar = 10 μm. (c) Ultrasound contrast is produced by doxycycline‐treated HEK293T mARGds single cell clones after 3 days of treatment (left panel) whereas cells not treated with doxycycline produce no ultrasound contrast (right panel). (d) Signal to noise ratio of ultrasound imaging is significantly stronger in doxycycline‐treated cells compared to non‐doxycycline treated cells and non‐mARGds cells, indicative of gas vesicle production (n = 6). (e) Phase contrast image of HEK293T mARGds cells after 3 days of doxycycline treatment with small puncta spread throughout the cell (white arrows), indicative of gas vesicle presence. (f) Phase contrast image of HEK293T mARGds cells undergoing no doxycycline treatment.
