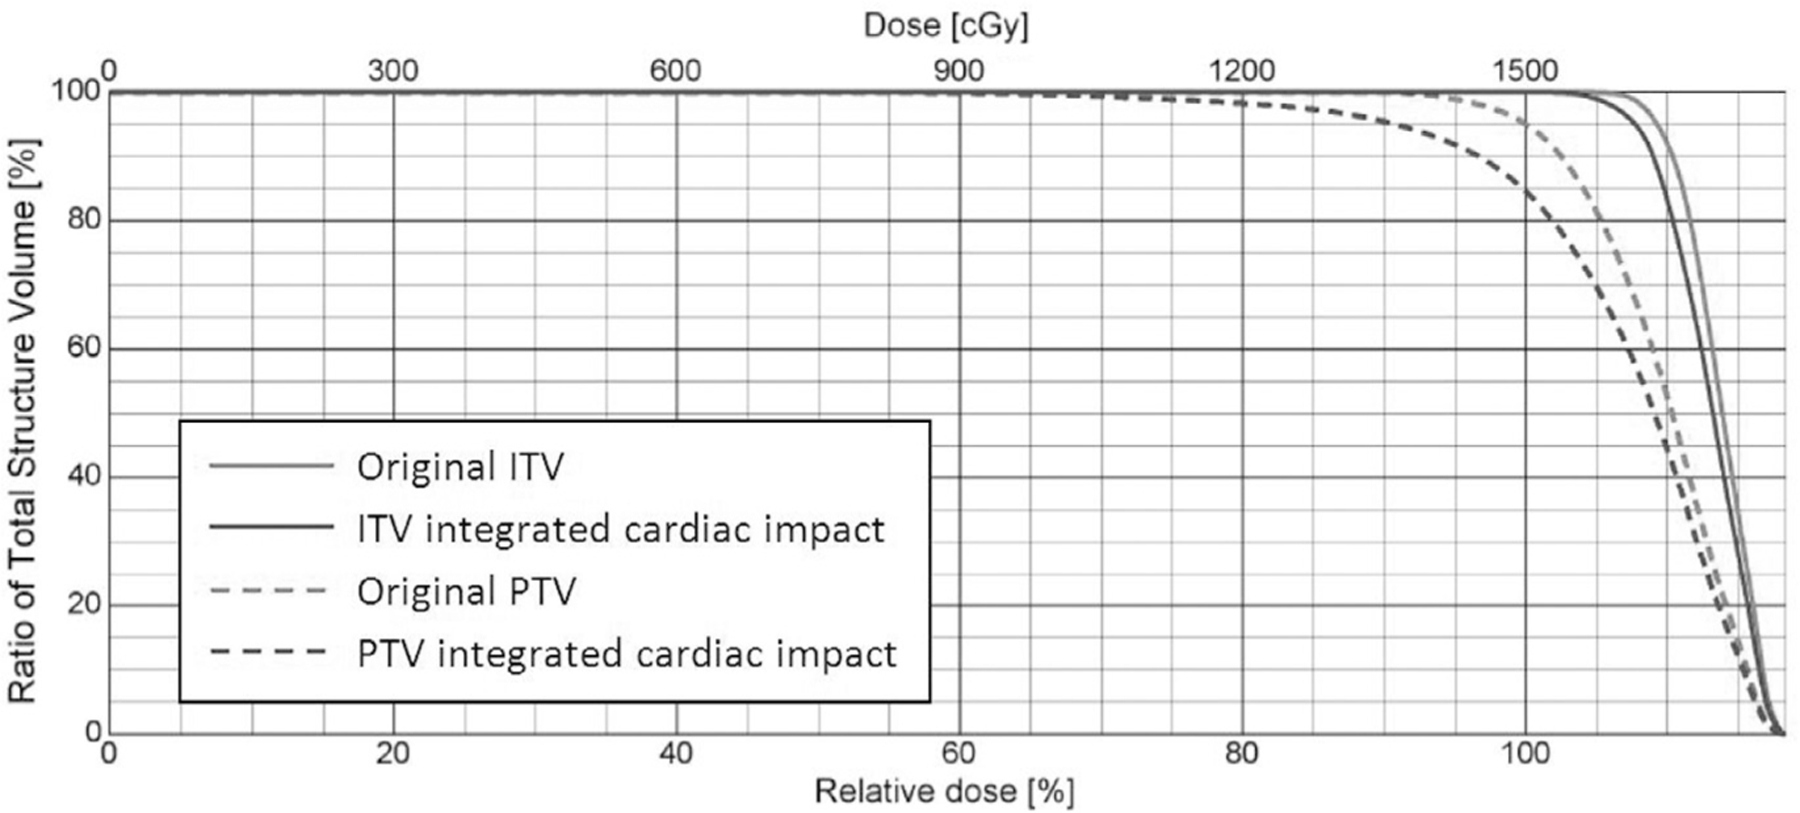
Fig. 3.

DVH of a simulated SBRT plan with different ITV and PTV definitions. Gray histograms correspond to the PTV and ITV without considering the cardiac induced motion; black histograms correspond to the revised ITV and PTV, taking the cardiac impact into account. Solid lines are histograms of ITVs, and dashed lines are histograms of PTVs.
