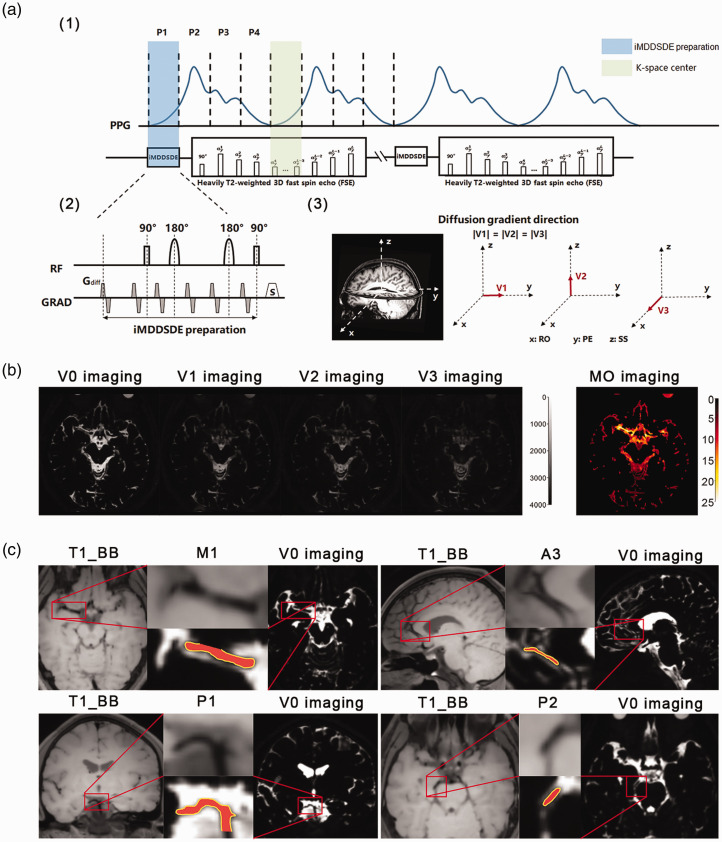
Figure 1.
The pulse sequence design and imaging results of the iMDDSDE-prepared, heavily T2-weighted 3 D FSE sequence. (a) The timing diagram of this sequence. A whole pulse cycle was divided to 4 phase (phase 1, phase 2, phase 3, phase 4) averagely. (b) The V0, V1, V2, V3 and MO images of one participant. V1: parallel to the anterior and posterior direction, V2: parallel to the left and right direction, and V3: parallel to the inferior and superior direction; b = 100 s/mm2 for all directions. Brighter color indicates greater magnitude of MO in corresponding areas in MO imaging and (c) The T1_BB and V0 images in 4 segments of cerebral arteries (M1 segment of the middle cerebral artery, A3 segment of the anterior cerebral artery, P1 segment of the posterior cerebral artery, P2 segment of the posterior cerebral artery. red) and there PVS (yellow). The arteries could be clearly discerned in our high resolution image (1 mm isotropic). The PVS was defined as the relatively high signal field around the arteries within 1 mm.

