Figure 5.
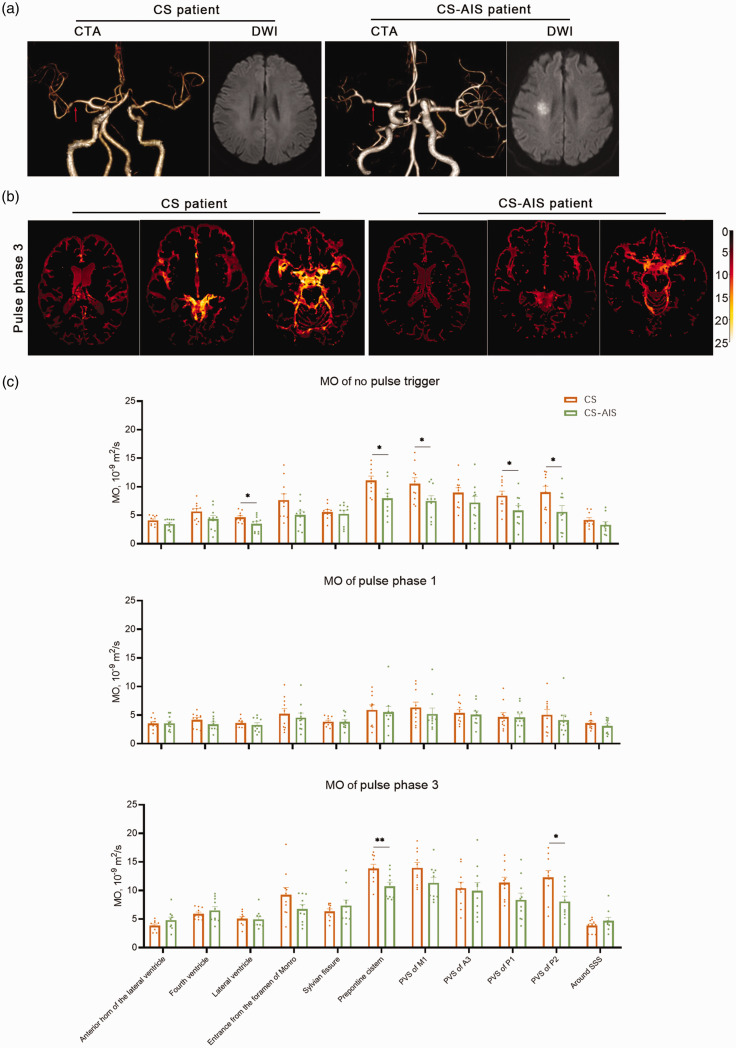
The comparation of the MO results in cerebrovascular stenosis (CS) and acute cerebral infarction (CS-AIS) patient groups. (a) CTA and DWI results of CS and CS-AIS patients. Both representative patients showed left middle cerebral artery stenosis (red arrow), and the CS-AIS patient had high signal intensity on DWI in the right corona radiata region. (b) MO imaging results of CS and CS-AIS participants. The MO imaging of phase 3 was brighter in the CS patient and (c) The statistical plot of mean MO results in CS and AIS groups. MO for no pulse trigger was lower in the lateral ventricles, prepontine cistern, PVS of M1, P1 and P2 of the for CS-AIS group compared to the CS group. MO for pulse phase 3 was lower in the prepontine cistern and PVS of P2 for the CS-AIS group compared to the CS group.

