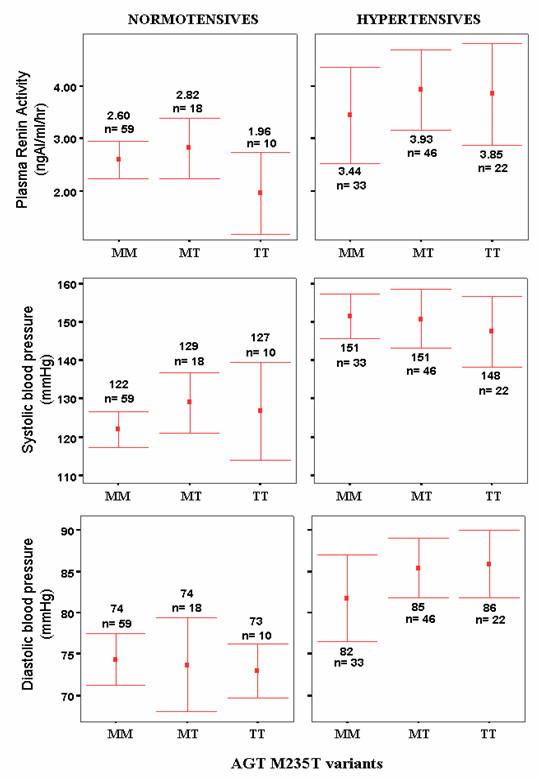
Figure 2.

Plasma renin activity (PRA), systolic blood pressure (SBP) and diastolic blood pressure (DBP) for normotensive and hypertensive subjects as grouped according to AGT M235T genotypes. The values were expressed as mean (as indicated by the red dots) whereas the bars represent the 95.0% confidence interval of standard deviations. N represents the number of subjects. MM, MT and TT correspond to homozygous wild-type, heterozygous and homozygous mutant, respectively.
