. 2024 Jan 4;14(3):468–491. doi: 10.1158/2159-8290.CD-23-0486

Figure 1.

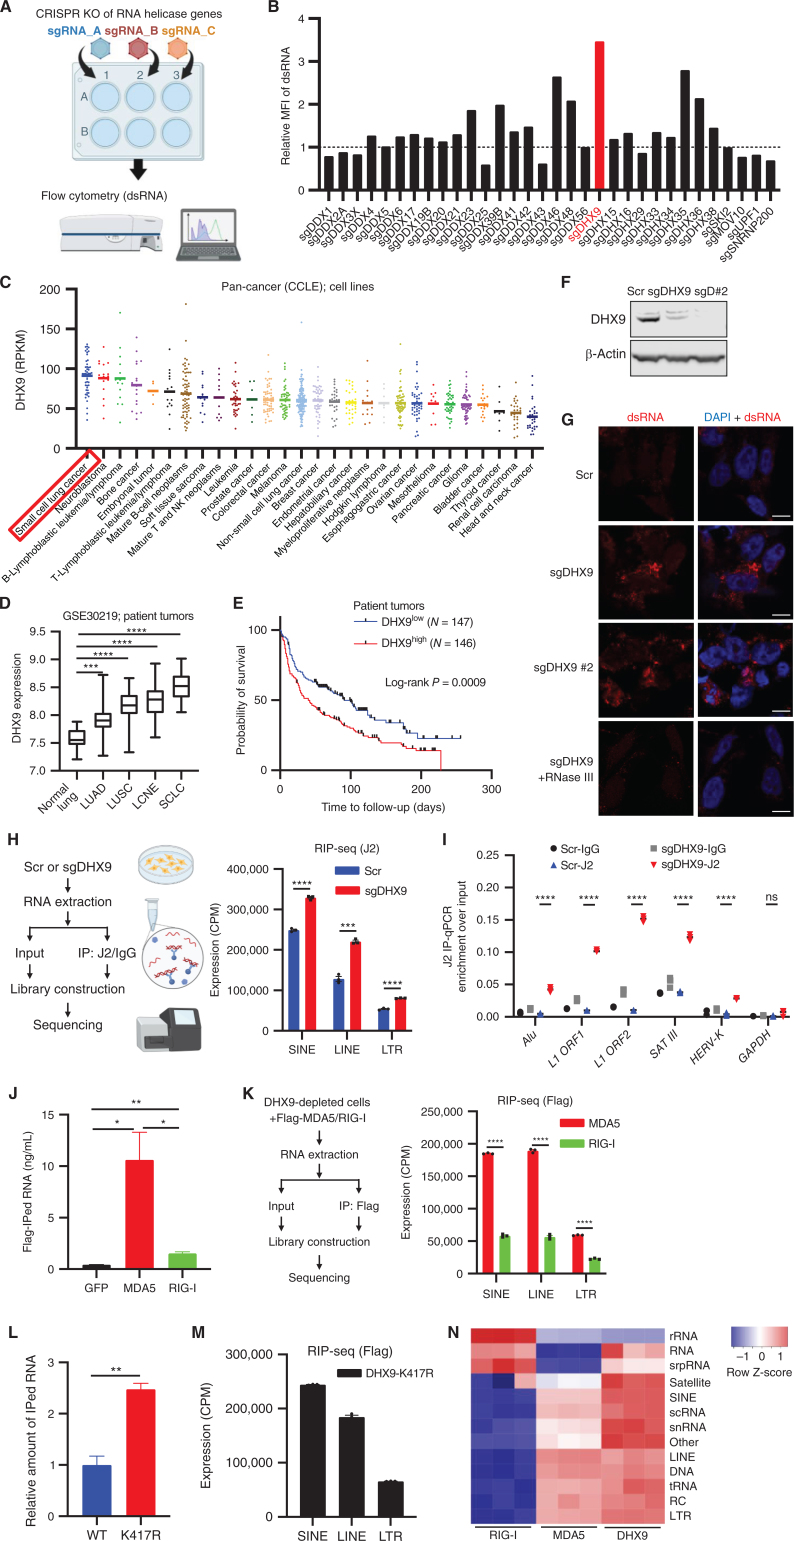
Figure 1. DHX9 suppresses double-stranded RNA (dsRNA) accumulation in SCLCs. A, Schematic of the screen to identify critical regulators of dsRNA. Created with BioRender.com. B, Result of the dsRNA regulator screen. Relative mean fluorescence intensity (MFI) of dsRNA level in H446 cells depleted of RNA helicase genes was compared. C, DHX9 mRNA expression was profiled in 28 cancer types. The expression data of cancer cell lines (CCLE) were downloaded from cBioPortal, and the cell lines were subgrouped based on the information from the Depmap database (sample_info.csv, “Subtype”). In case “Subtype” information is not available, “primary_disease” was used for subgrouping. D, Analysis of DHX9 expression in indicated lung cancer (patient tumor) subtypes and normal lung. Data were downloaded from the GEO database (GSE30219). Normal lung tissue (N = 14), LUAD (N = 85), LUSC (N = 61), LCNE (N = 56), SCLC (N = 20). Bars indicate the min and max values. E, Survival curve analysis of lung tumor patients. Data were downloaded from the GEO database (GSE30219). F, Immunoblot (IB) of DHX9 protein in Scramble, sgDHX9, and sgDHX9 #2 H446 cells. G, Immunofluorescence images of dsRNA (red) staining of Scramble or sgDHX9 cells (treated w/wo RNase III). Nuclei were counterstained with DAPI. Scale bar = 10 μm. H, Schematic (left) and result (right) of J2-RIP-seq analysis. Expression levels of specific retrotransposon classes (SINE, LINE, LTR) in Scramble or sgDHX9 cells are summarized (n = 3). CPM, counts per million. I, Result of RIP-qRT-PCR analysis of the indicated retrotransposon elements (n = 3). 36B4 was used as a reference. J, RNA amounts that were pulled down with Flag antibody were compared among Flag-GFP-, Flag-MDA5-, and Flag-RIG-I-expressing cells. K, Schematic (left) and result (right) of sequencing analysis of RNA pulled down with Flag antibody. Expression levels of specific retrotransposon classes (SINE, LINE, LTR) are summarized (n = 3). CPM: counts per million. L, Relative RNA amounts that were pulled down with Flag antibody were compared between 3xFlag-DHX9-WT- and 3xFlag-DHX9-K417R-expressing cells. M, Sequencing analysis of RNA pulled down with Flag antibody. Expression levels of specific retrotransposon classes (SINE, LINE, LTR) are summarized (n = 3). CPM: counts per million. N, Heat map of Flag-RIP-seq results comparing DHX9, MDA5, and RIG-I bound RNA species (n = 3). rRNA: ribosomal RNA, srpRNA: signal recognition particle RNA, scRNA: small conditional RNA, snRNA: small nuclear RNA, tRNA: transfer RNA, RC: rolling circle, RNA: other RNA repeats, DNA: DNA repeat elements. Data represent mean ± SEM. ns, not significant; *, P < 0.05; **, P < 0.01; ***, P < 0.001; ****, P < 0.0001 by unpaired Student t test (D, H, K, and L), log-rank test (E), one-way ANOVA (J), two-way ANOVA followed by the Tukey multiple comparisons test (I).

DHX9 suppresses double-stranded RNA (dsRNA) accumulation in SCLCs. A, Schematic of the screen to identify critical regulators of dsRNA. Created with BioRender.com. B, Result of the dsRNA regulator screen. Relative mean fluorescence intensity (MFI) of dsRNA level in H446 cells depleted of RNA helicase genes was compared. C, DHX9 mRNA expression was profiled in 28 cancer types. The expression data of cancer cell lines (CCLE) were downloaded from cBioPortal, and the cell lines were subgrouped based on the information from the Depmap database (sample_info.csv, “Subtype”). In case “Subtype” information is not available, “primary_disease” was used for subgrouping. D, Analysis of DHX9 expression in indicated lung cancer (patient tumor) subtypes and normal lung. Data were downloaded from the GEO database (GSE30219). Normal lung tissue (N = 14), LUAD (N = 85), LUSC (N = 61), LCNE (N = 56), SCLC (N = 20). Bars indicate the min and max values. E, Survival curve analysis of lung tumor patients. Data were downloaded from the GEO database (GSE30219). F, Immunoblot (IB) of DHX9 protein in Scramble, sgDHX9, and sgDHX9 #2 H446 cells. G, Immunofluorescence images of dsRNA (red) staining of Scramble or sgDHX9 cells (treated w/wo RNase III). Nuclei were counterstained with DAPI. Scale bar = 10 μm. H, Schematic (left) and result (right) of J2-RIP-seq analysis. Expression levels of specific retrotransposon classes (SINE, LINE, LTR) in Scramble or sgDHX9 cells are summarized (n = 3). CPM, counts per million. I, Result of RIP-qRT-PCR analysis of the indicated retrotransposon elements (n = 3). 36B4 was used as a reference. J, RNA amounts that were pulled down with Flag antibody were compared among Flag-GFP-, Flag-MDA5-, and Flag-RIG-I-expressing cells. K, Schematic (left) and result (right) of sequencing analysis of RNA pulled down with Flag antibody. Expression levels of specific retrotransposon classes (SINE, LINE, LTR) are summarized (n = 3). CPM: counts per million. L, Relative RNA amounts that were pulled down with Flag antibody were compared between 3xFlag-DHX9-WT- and 3xFlag-DHX9-K417R-expressing cells. M, Sequencing analysis of RNA pulled down with Flag antibody. Expression levels of specific retrotransposon classes (SINE, LINE, LTR) are summarized (n = 3). CPM: counts per million. N, Heat map of Flag-RIP-seq results comparing DHX9, MDA5, and RIG-I bound RNA species (n = 3). rRNA: ribosomal RNA, srpRNA: signal recognition particle RNA, scRNA: small conditional RNA, snRNA: small nuclear RNA, tRNA: transfer RNA, RC: rolling circle, RNA: other RNA repeats, DNA: DNA repeat elements. Data represent mean ± SEM. ns, not significant; *, P < 0.05; **, P < 0.01; ***, P < 0.001; ****, P < 0.0001 by unpaired Student t test (D, H, K, and L), log-rank test (E), one-way ANOVA (J), two-way ANOVA followed by the Tukey multiple comparisons test (I).