. 2024 Jan 4;14(3):468–491. doi: 10.1158/2159-8290.CD-23-0486

Figure 2.

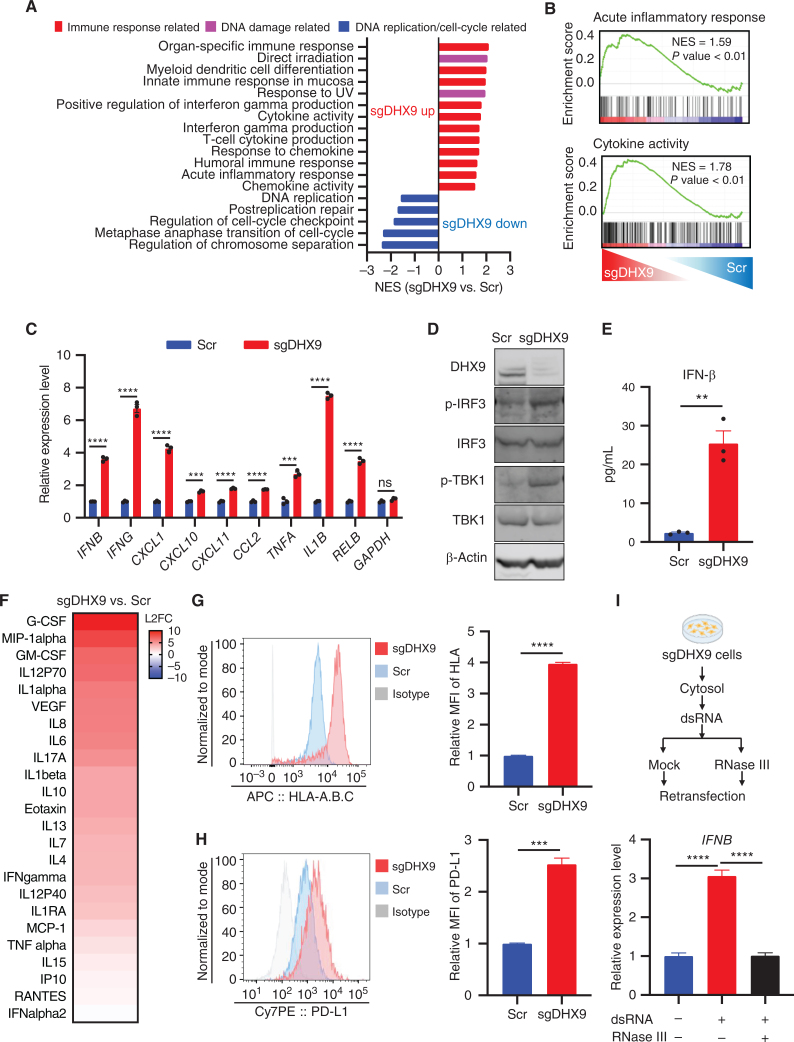
Figure 2. DHX9 depletion induces IFN response. A, Gene sets significantly upregulated and downregulated are shown, based on GSEA result. Immune response–related gene sets are in red, DNA damage–related gene sets are in pink, and DNA replication/cell-cycle–related gene sets are in blue. B, GSEA with C5 (ontology) gene sets based on RNA-seq results of sgDHX9 vs. Scramble cells. C, qRT-PCR analysis of the immune-related genes comparing Scramble and sgDHX9 H196 cells (n = 3). 36B4 was used as a reference. D, Immunoblot (IB) of the indicated proteins in Scramble and sgDHX9 H196 cells. E, ELISA of human IFNβ protein in conditioned medium from Scramble and sgDHX9 H196 cells. F, Log2 fold change (FC) of cytokine/chemokine differences of sgDHX9 H196 compared with Scramble. The cytokine/chemokine levels were quantified with Proteome Profiler Human Cytokine Array Kit. G and H, Flow cytometry analysis of HLA-A.B.C (G) or PD-L1 (H) expression on the cell surface of Scramble and sgDHX9 H196 cells. Data are representative of three independent experiments (left). Mean fluorescence intensity (MFI) was quantified by FlowJo (right; n = 3). I, Schematic (top) and result (bottom) of qRT-PCR analysis of IFNB gene in H196 cells treated with cytoplasmic dsRNA (n = 3). 36B4 was used as a reference. Data represent mean ± SEM. ns, not significant; *, P < 0.05; **, P < 0.01; ***, P < 0.001; ****, P < 0.0001 by unpaired Student t test (C, E, G, and H), one-way ANOVA (I).

DHX9 depletion induces IFN response. A, Gene sets significantly upregulated and downregulated are shown, based on GSEA result. Immune response–related gene sets are in red, DNA damage–related gene sets are in pink, and DNA replication/cell-cycle–related gene sets are in blue. B, GSEA with C5 (ontology) gene sets based on RNA-seq results of sgDHX9 vs. Scramble cells. C, qRT-PCR analysis of the immune-related genes comparing Scramble and sgDHX9 H196 cells (n = 3). 36B4 was used as a reference. D, Immunoblot (IB) of the indicated proteins in Scramble and sgDHX9 H196 cells. E, ELISA of human IFNβ protein in conditioned medium from Scramble and sgDHX9 H196 cells. F, Log2 fold change (FC) of cytokine/chemokine differences of sgDHX9 H196 compared with Scramble. The cytokine/chemokine levels were quantified with Proteome Profiler Human Cytokine Array Kit. G and H, Flow cytometry analysis of HLA-A.B.C (G) or PD-L1 (H) expression on the cell surface of Scramble and sgDHX9 H196 cells. Data are representative of three independent experiments (left). Mean fluorescence intensity (MFI) was quantified by FlowJo (right; n = 3). I, Schematic (top) and result (bottom) of qRT-PCR analysis of IFNB gene in H196 cells treated with cytoplasmic dsRNA (n = 3). 36B4 was used as a reference. Data represent mean ± SEM. ns, not significant; *, P < 0.05; **, P < 0.01; ***, P < 0.001; ****, P < 0.0001 by unpaired Student t test (C, E, G, and H), one-way ANOVA (I).