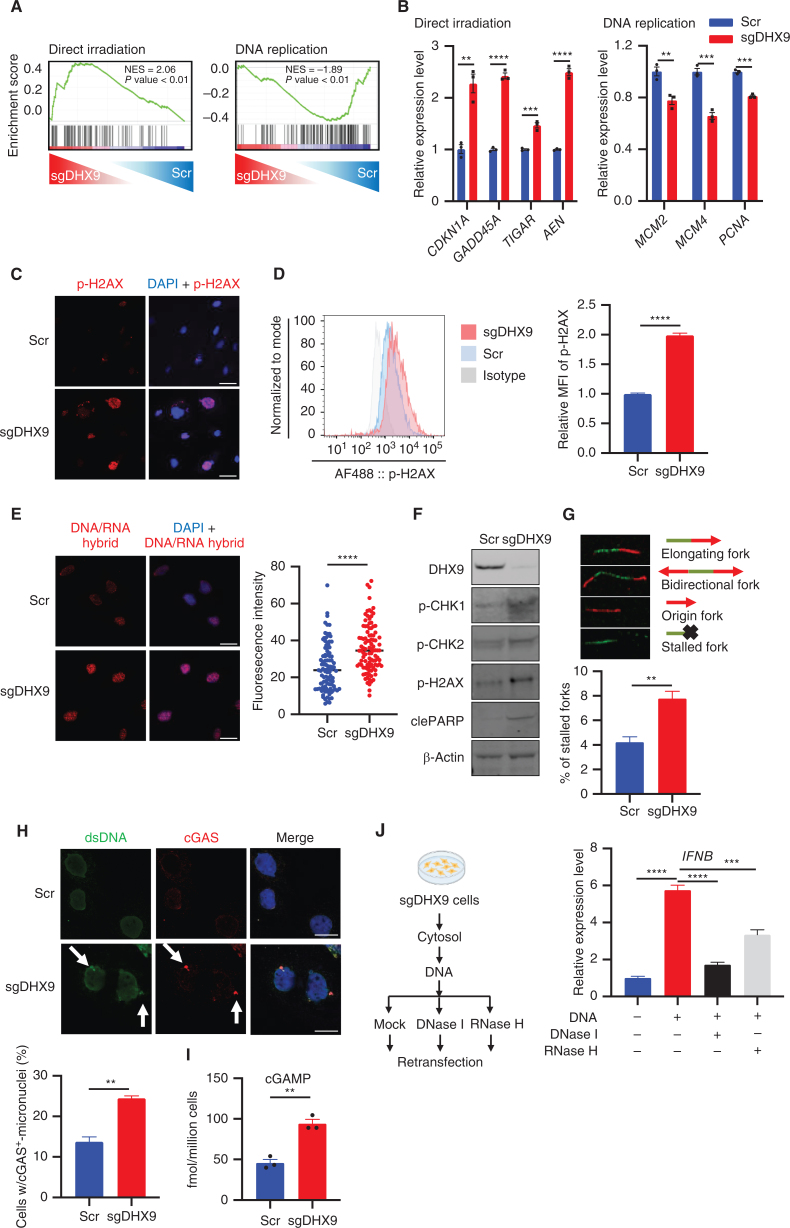
Figure 3.
DHX9 depletion causes R-loop accumulation, DNA damage, and cGAS–STING pathway activation. A, GSEA with C2 (curated) gene sets, based on RNA-seq results of sgDHX9 vs. Scramble cells. B, qRT-PCR analysis of the direct irradiation response and replication-related genes comparing Scramble and sgDHX9 H196 cells (n = 3). 36B4 was used as a reference. C, Immunofluorescence images of p-H2AX (red) staining of Scramble and sgDHX9 H196 cells. Scale bar = 50 μm. D, Flow cytometry analysis of intracellular p-H2AX levels in Scramble and sgDHX9 H196 cells. Data are representative of three independent experiments (left). Mean fluorescence intensity (MFI) was quantified by FlowJo (right; n = 3). E, Immunofluorescence images of DNA/RNA hybrid (red) staining of Scramble and sgDHX9 H196 cells (left) and quantification of fluorescence intensity (right; 150 cells were counted per group, n = 3). Scale bar = 50 μm. F, Immunoblot (IB) of the indicated proteins in Scramble and sgDHX9 H196 cells. G, DNA fiber assay of Scramble and sgDHX9 H196 cells. The percentage of stalled forks over the total number of different replication structures was measured (>150 labeled forks were counted per group, n = 3). H, Immunofluorescence images of dsDNA (green) and cGAS (red) staining of Scramble and sgDHX9 H196 cells (left) and quantification of cells with cGAS+-micronuclei (150 cells were counted per group, n = 3). Scale bar = 25 μm. I, ELISA of human cGAMP protein in Scramble and sgDHX9 H196 cells. J, Schematic (left) and result (right) of qRT-PCR analysis of IFNB gene in H196 cells treated with cytoplasmic DNA (n = 3). 36B4 was used as a reference. Data represent mean ± SEM. ns, not significant; *, P < 0.05; **, P < 0.01; ***, P < 0.001; ****, P < 0.0001 by unpaired Student t test (B, D, E, G, H, and I), one-way ANOVA (J).

