. 2024 Jan 4;14(3):468–491. doi: 10.1158/2159-8290.CD-23-0486

Figure 4.

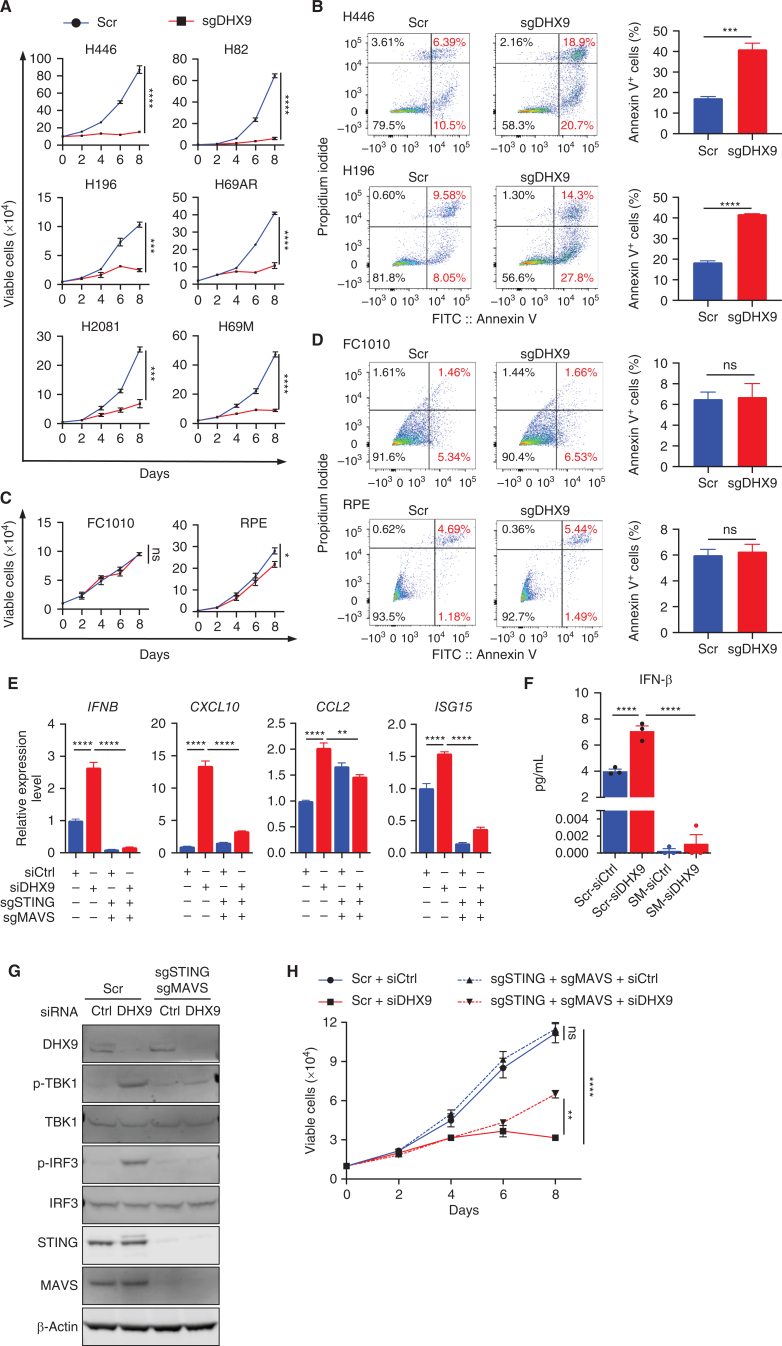
Figure 4. DHX9 loss triggers dsRNA and dsDNA antiviral sensing pathways and IFN signaling in SCLC cells. A, Growth curves of the indicated SCLC cell lines (n = 3). B, Flow cytometry analysis of apoptotic (annexin V+) cells in Scramble and sgDHX9 H196 and H446 cells. Data are representative of three independent experiments (left). Quantification of apoptotic cells is shown (right; n = 3). C, Growth curves of the indicated normal cell lines (n = 3). D, Flow cytometry analysis of apoptotic (annexin V+) cells in Scramble and sgDHX9 FC1010 and RPE cells. Data are representative of three independent experiments (left). Quantification of apoptotic cells is shown (right; n = 3). E, qRT-PCR analysis of the immune-related genes comparing Scramble and sgSTING + sgMAVS H196 cells transfected with siCtrl or siDHX9 (n = 3). 36B4 was used as a reference. F, ELISA of human IFNβ protein in conditioned medium from Scramble and sgSTING + sgMAVS H196 cells, transfected with siCtrl or siDHX9 (n = 3). SM: sgSTING + sgMAVS. G, Immunoblot (IB) of the indicated proteins in Scramble and sgSTING + sgMAVS H196 cells transfected with siCtrl or siDHX9. H, Growth curves of Scramble and sgSTING + sgMAVS H196 cells, transfected with siCtrl or siDHX9 (n = 3). Data represent mean ± SEM. ns, not significant; *, P < 0.05; **, P < 0.01; ***, P < 0.001; ****, P < 0.0001 by unpaired Student t test (A, B, C, and D), two-way ANOVA followed by Tukey multiple comparisons tests (E, F, and H).

DHX9 loss triggers dsRNA and dsDNA antiviral sensing pathways and IFN signaling in SCLC cells. A, Growth curves of the indicated SCLC cell lines (n = 3). B, Flow cytometry analysis of apoptotic (annexin V+) cells in Scramble and sgDHX9 H196 and H446 cells. Data are representative of three independent experiments (left). Quantification of apoptotic cells is shown (right; n = 3). C, Growth curves of the indicated normal cell lines (n = 3). D, Flow cytometry analysis of apoptotic (annexin V+) cells in Scramble and sgDHX9 FC1010 and RPE cells. Data are representative of three independent experiments (left). Quantification of apoptotic cells is shown (right; n = 3). E, qRT-PCR analysis of the immune-related genes comparing Scramble and sgSTING + sgMAVS H196 cells transfected with siCtrl or siDHX9 (n = 3). 36B4 was used as a reference. F, ELISA of human IFNβ protein in conditioned medium from Scramble and sgSTING + sgMAVS H196 cells, transfected with siCtrl or siDHX9 (n = 3). SM: sgSTING + sgMAVS. G, Immunoblot (IB) of the indicated proteins in Scramble and sgSTING + sgMAVS H196 cells transfected with siCtrl or siDHX9. H, Growth curves of Scramble and sgSTING + sgMAVS H196 cells, transfected with siCtrl or siDHX9 (n = 3). Data represent mean ± SEM. ns, not significant; *, P < 0.05; **, P < 0.01; ***, P < 0.001; ****, P < 0.0001 by unpaired Student t test (A, B, C, and D), two-way ANOVA followed by Tukey multiple comparisons tests (E, F, and H).