Figure 3.

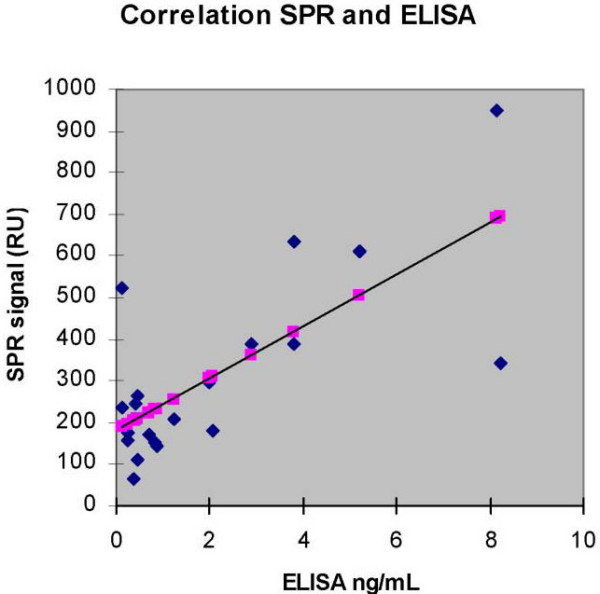
Correlation between the concentration of HGF in faeces obtained by ELISA and signal responses by SPR (Spearman rank correlation coefficient n = 20, r = 0.72, p < 0.001). The shadow points along the regression line are not data points.

Correlation between the concentration of HGF in faeces obtained by ELISA and signal responses by SPR (Spearman rank correlation coefficient n = 20, r = 0.72, p < 0.001). The shadow points along the regression line are not data points.