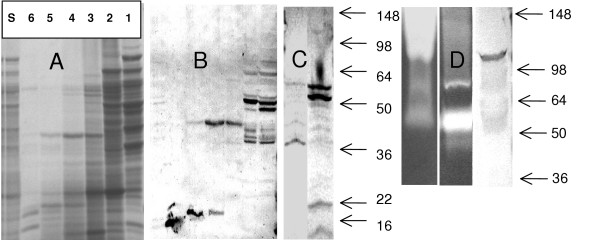
Figure 1.
SDS-PAGE of BACS fractions separated on size exclusion column (A) and Western blots: fractions (A) with specific antisera a-M4EL (B), BACS with a-M4AC (C, left lane), BACS with a-M4EP (C, right lane), BACS with a-M9Coll (D, right lane), and zymograms of caseinolytic and gelatinolytic activities of BACS (D, left and center lanes, correspondingly). Molecular masses (KDa) of the marker proteins are indicated by arrows. In A, s denoted BACS, and numbers above correspond to column fractions. In zymogram gels 3 μl of BACS were loaded.

