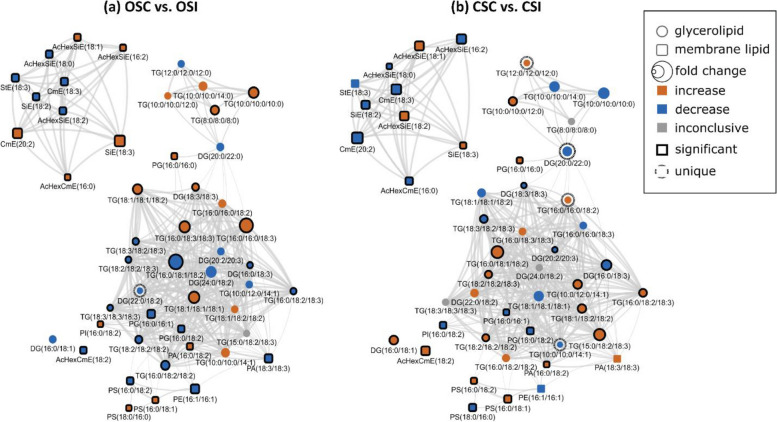
Fig. 11.
Lipid structural similarity network displaying differences in stem membrane lipids and glycerolipids in susceptible and tolerant soybean cultivars inoculated with P. sojae relative to control plants. a Control susceptible soybean cultivar (OSC) versus inoculated (OSI); b control tolerant soybean cultivar (CSC) versus inoculated (CSI). The biochemical lipid network demonstrates fold differences in 21 stem membrane lipid molecular species and 28 glycerolipid molecular species following inoculation with P. sojae. Lipid SMILES identifiers were used to calculate PubChem molecular fingerprints and structural similarities. Mapped networks, displaying significance of fold differences in lipids were calculated for all comparisons. Network visualizations display lipids connected based on structural Tanimoto similarity ≥ 0.8 (edge width: 0.8 to 1.0). Node size displays fold differences of means between comparisons and color shows the direction of change compared to control (orange: increased; blue: decreased; gray: inconclusive). Node shape displays lipid structural type (rounded square: membrane lipids; circle: glycerolipids). Lipids displaying significant differences between treatment groups (p ≤ 0.05) are denoted with black borders

