Fig. 2.
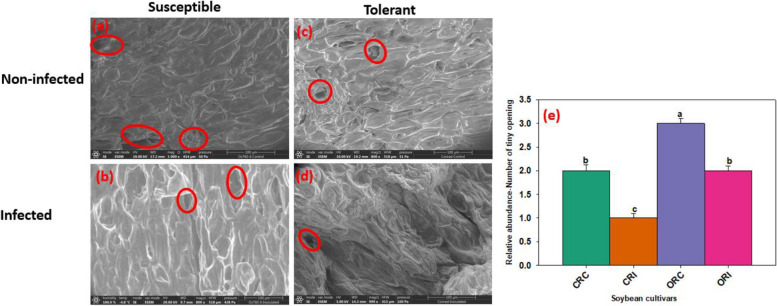
Scanning electron microscopy showing the tiny opening of root cortical cells of susceptible and tolerant soybean cultivars when inoculated with P. sojae. Tiny opening of cortical cells of the non-infected susceptible soybean cultivar (ORC; a), infected susceptible soybean cultivar (ORI; b), non-infected tolerant soybean cultivar (CRC; c), infected tolerant soybean cultivar (CRI; d). Red circles denote the tiny opening of epidermal cells of the roots. The tiny opening of epidermal cells appears to be larger in the susceptible cultivar compared to tolerant cultivar after infection. Bars: (a-d) 100 µm. Bar charts indicating the relative abundance of the tiny openings present in the cortical cells of soybean root as mean ± SE (e; n > 5). Significant differences between the treatments are indicated using letters (a-d) on top of the bars following means separation using Fisher’s LSD and ANOVA to assess significance of the model (α = 0.05)

