Fig. 5.
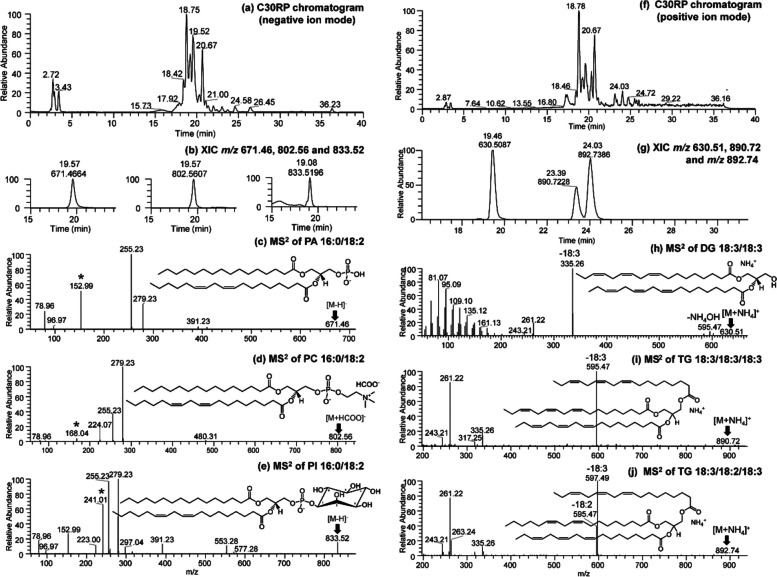
Chromatogram demonstrating the UHPLC-C30RP-HESI-HRAM-MS separation of the membrane lipids and glycerolipids in the root and stem of susceptible and tolerant soybean cultivars. a LC–MS chromatogram of separated membrane lipids in negative ion mode, (b) Extracted ion chromatogram (XIC) of m/z 671.46, 802.56 and 833.52 precursor ions of the three selected polar lipids, (c) MS2 spectrum of m/z 671.46 identified as PA 16:0/18:2 [M-H]−, (d) MS2 spectrum of m/z 802.56 identified as PC 16:0/18:2 [M + HCOO]− and (e) MS2 spectrum of m/z 833.52 representing PI 16:0/18:2 [M-H]− identified in the negative ion mode; (f) LC–MS chromatogram in positive ion mode of separated glycerolipids in positive ion mode (g) Extracted ion chromatogram (XIC) of m/z 630.51, 890.72 and 892.74 precursor ions of the three selected glycerolipids, (h) MS2 spectrum of m/z 630.51 identified as DG 18:3/18:3 [M + NH4]+, (i) MS2 spectrum of m/z 802.56 identified as TG 18:3/18:3/18:3 [M + NH4]+ and (j) MS2 spectrum of m/z 833.52 representing TG 18:3/18:2/18:3 [M + NH4]+ identified in the positive ion mode. PA = phosphatidic acid, PC = phosphatidylcholine, and PI = phosphatidylinositol, DG = diacylglycerol, TG = triacylglycerol, and * represent the head group for each of the lipid class presented

