Figure 6.
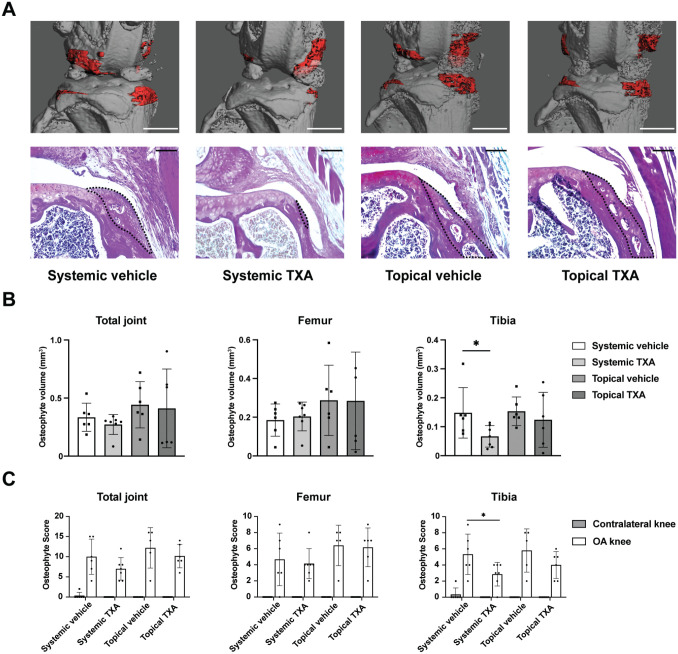
Systemic TXA treatment reduces tibial osteophyte formation after ACLT. (A) Representative 3-dimensional μCT reconstruction and Bone-Inflammation-Cartilage staining images of osteophytes 4 weeks after ACLT. For the upper panel, osteophytes are shown in red (scale bar = 1 mm); for the lower panel, osteophytes are marked by the black dotted line (scale bar = 100 μm). (B) μCT quantitative analysis of osteophyte volume in the total joint, femoral side, and tibial side. n = 6-7 per group as indicated (1-way ANOVA followed by the Tukey post hoc test). (C) Osteophyte scoring of the total joint, femoral side, and tibial side. n = 5-7 per group as indicated (2-way analysis of variance followed by the Tukey post hoc test). The data are expressed as mean ± SD; *P < .05 for comparisons denoted by bar. μCT, micro−computed tomography; ACLT, anterior cruciate ligament transection; OA, osteoarthritis; TXA, tranexamic acid.

