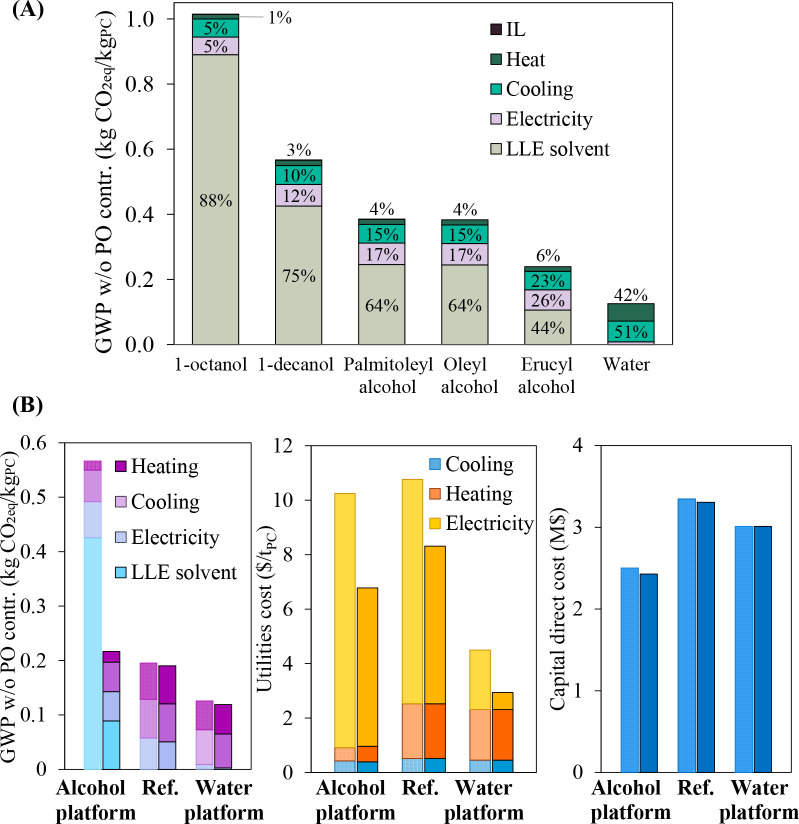
Figure 32.
(A) Influence of different solvents in LLE-based separation strategies on GWP to produce 1 kg of PC. The reaction was conducted at 15 bar in RSTOIC model for molar ratios of 1:1 and 200:1 for epoxide:CO2 and epoxide:IL, respectively. (B) Environmental and economic indicators of three CO2 conversion processes before (left, soft colors) and after (right, dark colors) optimization of environmental impact. Reproduced from ref (48). Copyright 2022. Wiley.

