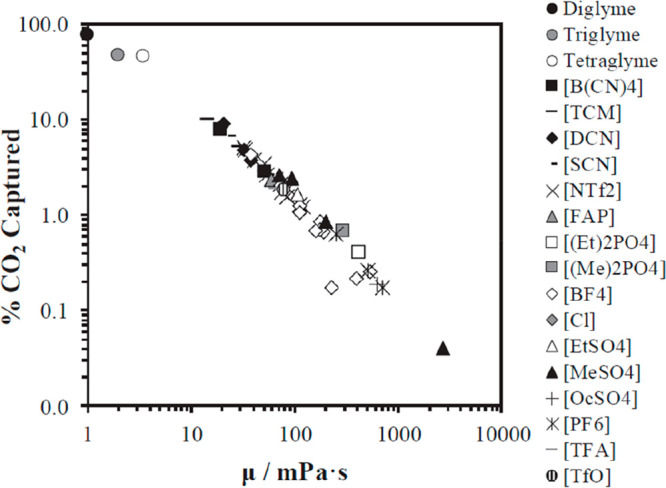
Figure 5.

Percentage (%) of CO2 absorbedby ILs and glymes from postcombustion flue gas (1,000 kmol/h, 13 mol % CO2) in packing absorption column plotted as a function of viscosity, using rate-based RADFRAC model and IL mass flow of 400 ton/h, fractional capacity of 62%, column height of 1 m, and 10 equilibrium stages. Symbols indicate glyme or anion forming IL. Reproduced from ref (50). Copyright 2019 Elsevier.
