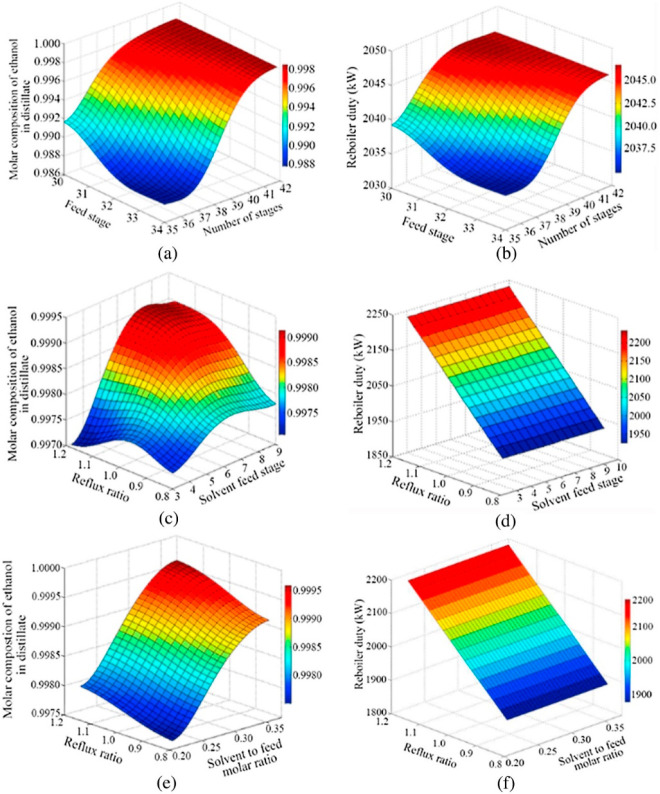
Figure 54.
Surface diagrams for monitoring ethanol purities and reboiler duties versus RR, S/F, feed stage, solvent feed stage, and N during dehydration of 100 kmol/h feed comprising mixture of 85% pure alcohol (on molar basis) at 1 bar. Reproduced from ref (285). Copyright 2016 Elsevier.

