
Figure 56.
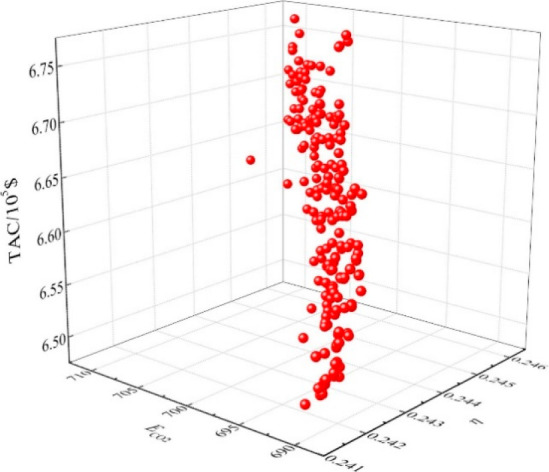
Scattering 3D diagram relating TAC, CO2 emissions (ECO2), and thermodynamic efficiency (η) for separating ethyl acetate–ethanol–water at 100 kPa and considering 100 kmol/h of feed containing molar compositions of 55.58, 18.52, and 27.90% for ethyl acetate, methanol, and water, respectively, by fixing ethyl acetate purity above 0.9995 (on molar basis) and varying S/F and RR. Reproduced from ref (290). Copyright 2019 Elsevier.