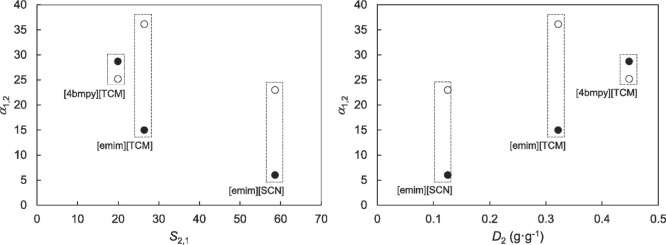
Figure 58.
Relative volatility of n-heptane from toluene (α1,2) at 50 °C (full symbols) and 90 °C (empty symbols) and S/F ratio of 10 vs. toluene/n-heptane selectivities (S2,1) and toluene distribution ratios (D2) at 40 °C with the same hydrocarbon feed. Reproduced from ref (261). Copyright 2018 Elsevier.

