Figure 62.

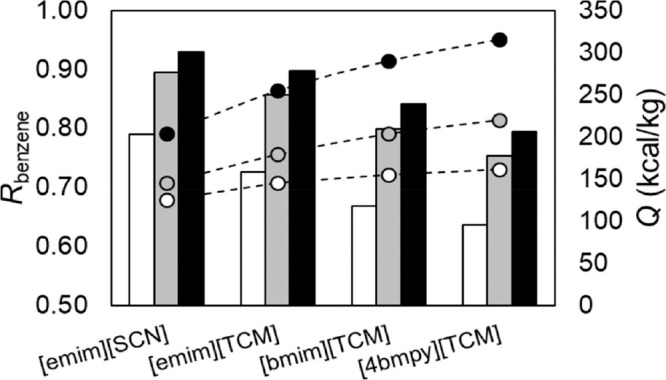
Benzene recovery in residue plotted as a function of IL and S/F ratio at 1 bar and N = 20, monitoring energy consumption. S/F = 1 white, 3 gray, and 5 black. Reproduced from ref (59). Copyright 2022 ACS.

Benzene recovery in residue plotted as a function of IL and S/F ratio at 1 bar and N = 20, monitoring energy consumption. S/F = 1 white, 3 gray, and 5 black. Reproduced from ref (59). Copyright 2022 ACS.