
Figure 4.
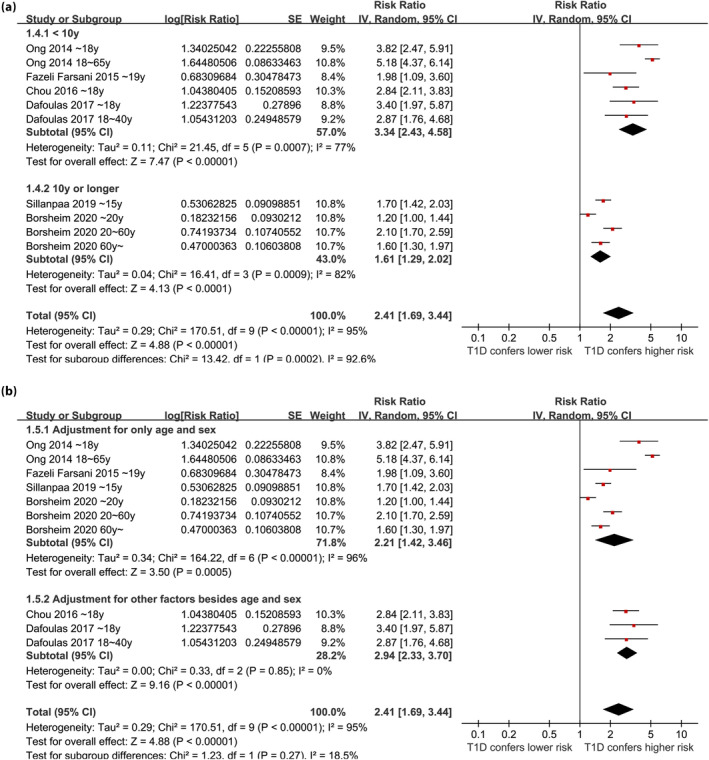
Forest plots for the subgroup analyses regarding the association between type 1 diabetes and the risk of epilepsy; (a) subgroup analysis according to follow‐up durations; and (b) subgroup analysis according to the variables adjusted.
Official websites use .gov
A
.gov website belongs to an official
government organization in the United States.
Secure .gov websites use HTTPS
A lock (
) or https:// means you've safely
connected to the .gov website. Share sensitive
information only on official, secure websites.
Forest plots for the subgroup analyses regarding the association between type 1 diabetes and the risk of epilepsy; (a) subgroup analysis according to follow‐up durations; and (b) subgroup analysis according to the variables adjusted.