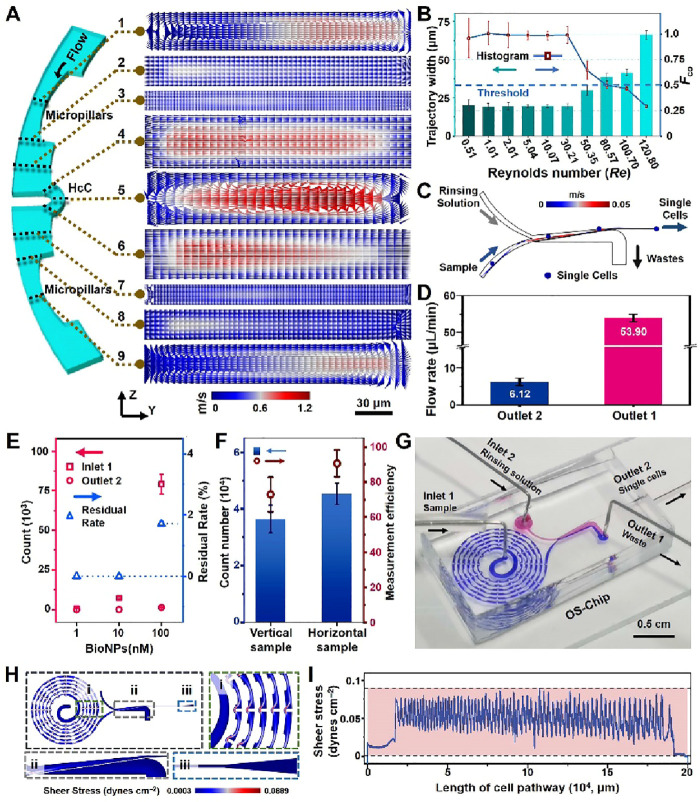
Figure 2.
Evaluation of OS-Chip. (A) Fluid velocity field of nine cross sections (1–9) in the y-axis along the micropillar-HcC-micropillars at a flow rate of 10 μL/min and Re = 1.01. (B) Fco values in the D3-ESC configuration under various flow rates of 5, 10, 20, 50, 100, 300, 500, 800, 1000, and 1200 μL/min (Re = 0.51, 1.01, 2.01, 5.04, 10.07, 30.21, 50.35, 80.57, 100.70, and 120.80). (C) Simulation results of the single-cell trajectory achieved in the purifier with P2 configuration. (D) The actual flow rates in Outlets 1 and 2. An independent t-test is performed to obtain statistical pairwise differences between Outlets 1 and 2 (***p < 0.001). (E) Evaluation of the purification performance for the P2 by using different concentrations of AuNPs suspension collected from the Outlet 2. Residual Rate represents residual quantity of AuNPs in the collected medium from Outlet 2. (F) The comparison of transport efficiency or measurement efficiency for the single cells between the vertical and horizontal sampling modes. (G) Photograph of the OS-Chip with two dyes (blue and red) loading in two inlets (Inlet 1 and Inlet 2). Shear stress gradient (H) and shear stress of the whole cell path (I) in the microfluidic chip. Three independent chips prepared by using biological replicates (n = 3) were used for each data point.

