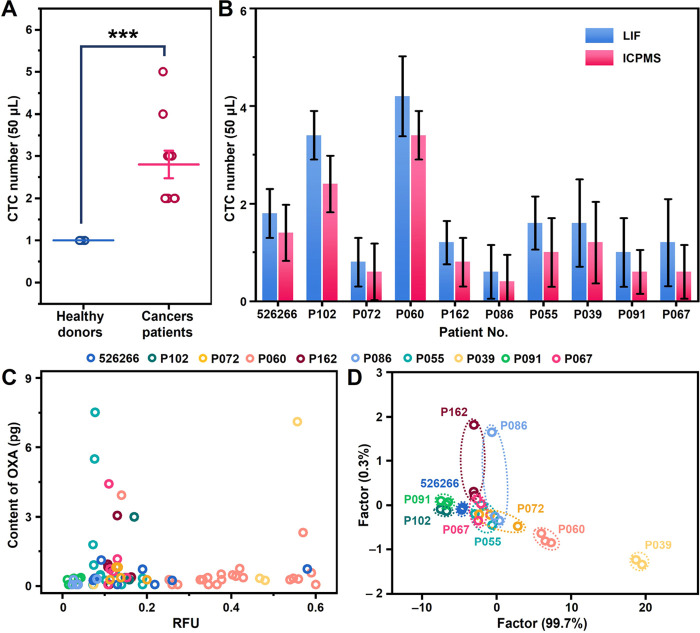
Figure 4.
Evaluation of performance of μCytoMS on clinical samples. (A) Quantification of CTCs in 50 μL of blood samples from patients and healthy controls. (B) The numbers of CTCs were detected respectively from 50 μL of cancer patient blood with detection by LIF and ICP-MS. (C) The scatter plot for μCytoMS profiling of individual patient CTCs. (D) LDA canonical score plots for the response of the BioNPs assemblies to single CTCs from ten patients. The data indicate mean ± standard deviation (SD). Three independent groups to be tested by using biological replicates (n = 5) were used for each data point. The Student’s t test was used to compare the means of two groups (A).

